- AUD/JPY struggles to keep recovery gains from the short-term key support confluence.
- A joint of 100-day EMA and 61.8% Fibonacci retracement acts as the tough resistance.
- MACD teases sellers ahead of the RBA.
Having filed to extend the recovery moves beyond 68.65, AUD/JPY drops to 68.50 amid the initial Asian session on Tuesday. That said, the pair previously bounced off the 21-day EMA and six-week-old support line.
Not only its failure to keep the pullback but the MACD histogram also suggests the pair’s weakness. However, traders are waiting for the key RBA meeting, up for publishing at 04:30 GMT, for fresh clues.
Should AUD/JPY prices remain below 68.50/45 support confluence after the event, April 21 low near 67.30 and 38.2% Fibonacci retracement of December 2019 to March 2020 fall, around 66.25 will lure the sellers.
On the upside, April 14 high near 69.30 can please the buyers during the sustained trading beyond 68.50 post-event.
Though, 100-day EMA and 61.8% Fibonacci retracement near 70.20/25 could question the bulls afterward.
Additionally, a downward sloping trend line from January 16, at 70.55 now, offers an extra upside barrier during the pair’s run-up beyond 70.25.
AUD/JPY daily chart
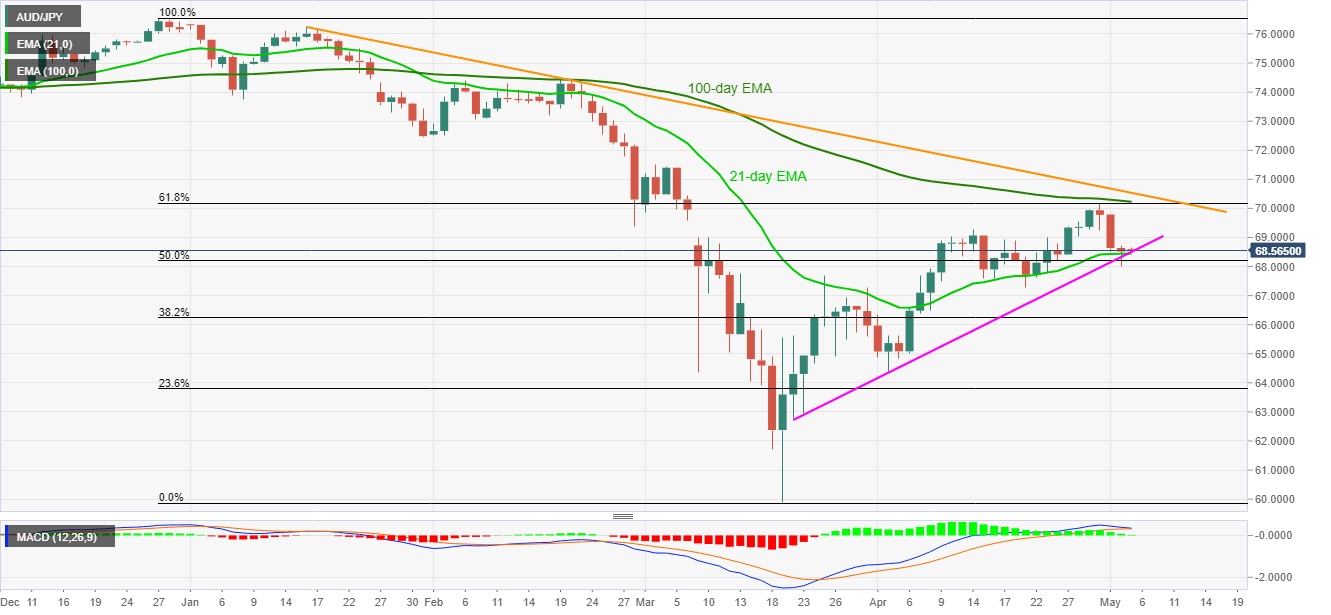
Trend: Pullback expected
