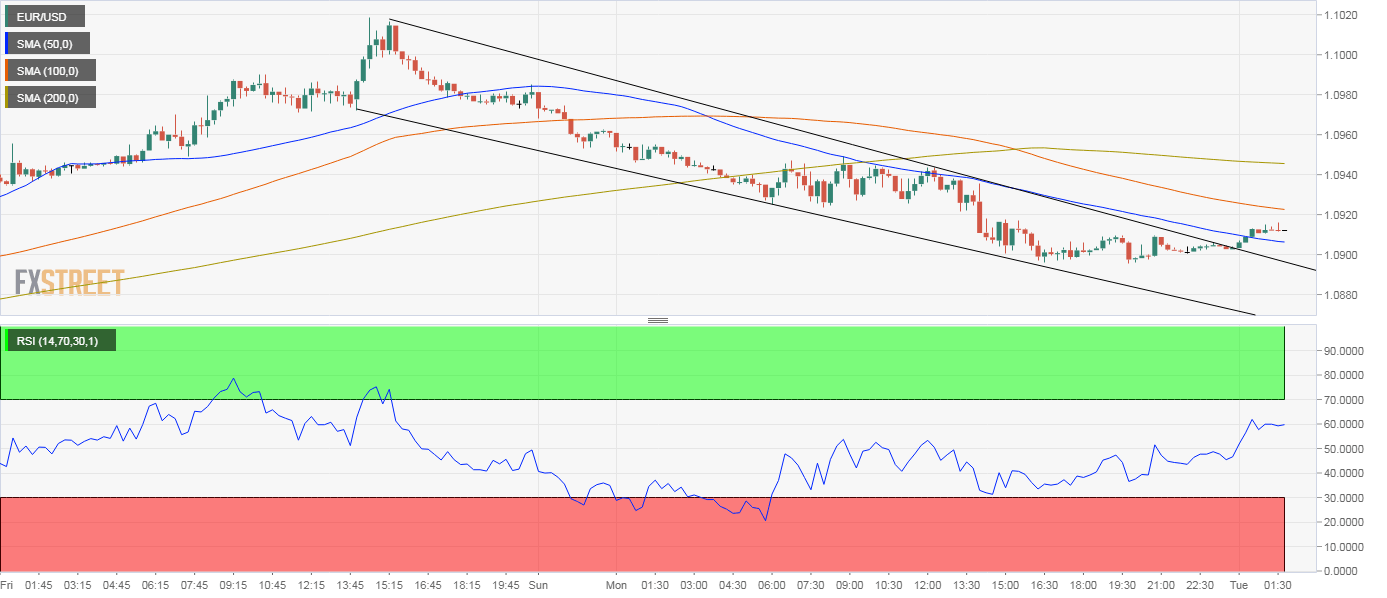
- EUR/USD’s 15-minute chart shows a falling channel breakout.
- The pair attempts a convincing move above the 100-hour average.
EUR/USD is trading above the 100-hour average at 1.0912 at press time, having found dips just below the psyhcological support of 1.09 during the overnight trade.
The 15-minute chart shows the pair has broken out of a falling channel, indicating an end of the pullback from Friday’s high of 1.1019 and resumption of the uptrend from the April 24 low of 1.0727.
The breakout is also backed by an above-50 reading on the 15-min chart relative strength index. The daily chart RSI, too, is hovering above 50.
The pair could challenge the hourly chart horizontal resistance at 1.0935 in the next couple of hours. A violation there would expose the 50-hour average at 1.050.
On the downside, a move below 1.09 would invalidate the channel breakout seen on the 15-min chart and will likely invite stronger chart-driven selling, leading to a drop to the 200-hour average at 1.0863.
15-minute chart
Trend: Bullish
Technical levels
