- USD/CAD drops back towards 21-day SMA after Monday’s bearish candlestick formation.
- 50-day SMA and the key Fibonacci retracements can question further downside.
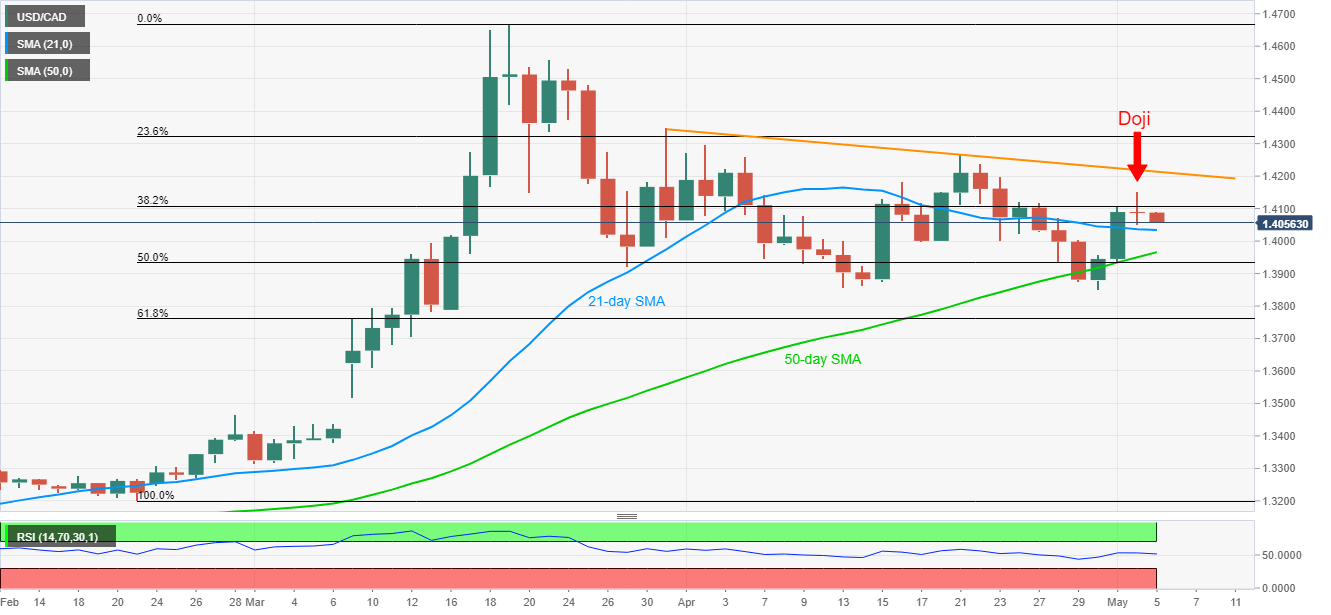
- A five-week-old falling trend line restricts the recovery moves.
USD/CAD declines to 1.4065, down 0.17% on a day, during the early Tuesday’s trading. In doing so, the Loonie pair justifies the previous day’s trend-reversal suggesting candlestick formation.
That said, the quote currently drops towards a 21-day SMA level of 1.4035 while 1.4000 and 1.3965, comprising 50-day SMA, could challenge further downside.
It should also be noted that 50% and 61.8% Fibonacci retracements of February-March upside, respectively around 1.3930 and 1.3760, act as additional downside filters.
Meanwhile, an upside break of 1.4155 will defy Monday’s candlestick formation and can aim for the five-week-old resistance line, at 1.4215 now.
USD/CAD daily chart
Trend: Pullback expected
