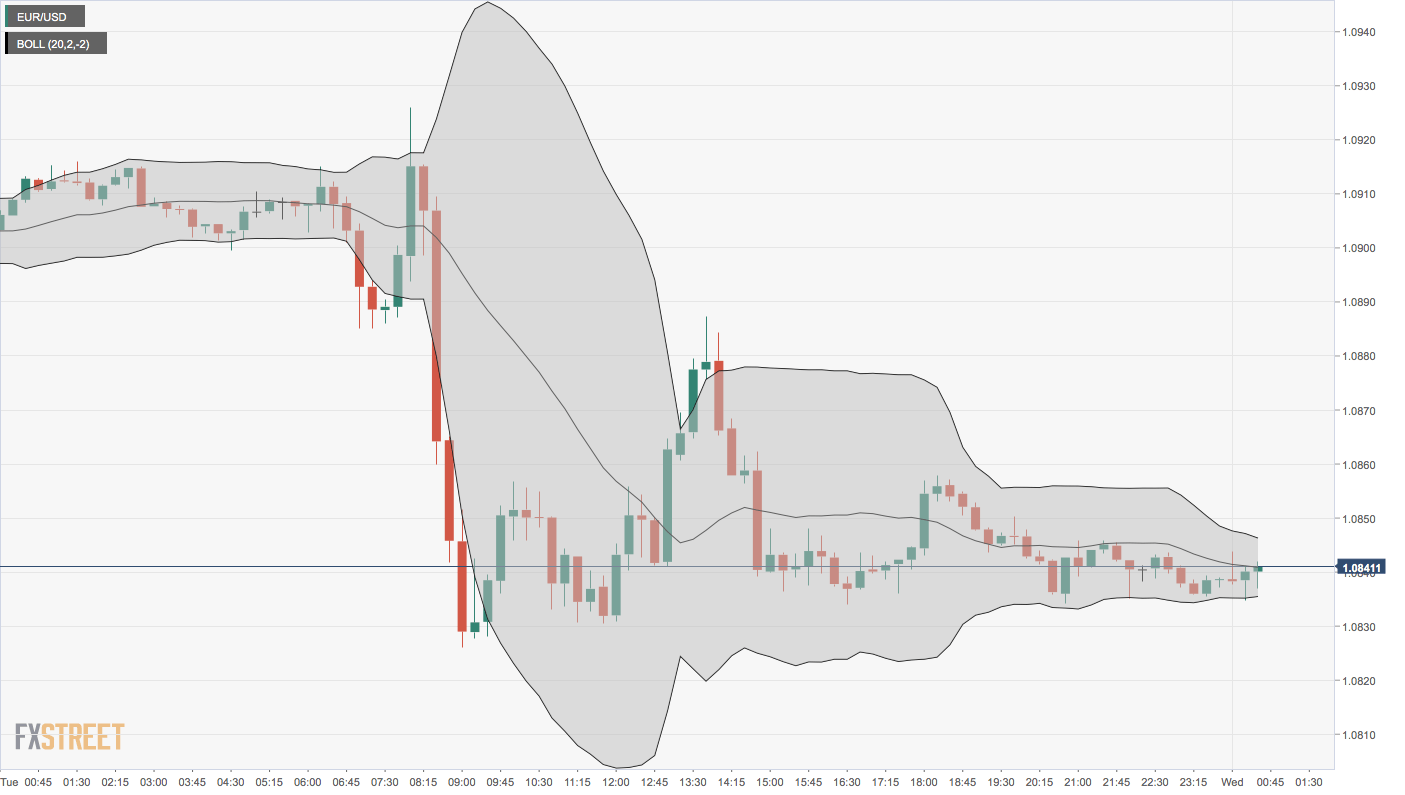
- EUR/USD’s 15-minute chart a tightening of Bollinger bands.
- A move through the lower band will likely yield deeper losses.
With EUR/USD moving in a sideways manner in the range of 1.0830 to 1.0860 for over five hours, the Bollinger Bands have tightened sharply.
Bollinger bands are volatility bands placed +2/-2 standard deviation above the 20-period moving average. The narrowing of bands represents low volatility.
A prolonged tightening of bands or low volatility period often paves the way for a big move in either direction.
In Euro’s case, that big move could happen to the downside, as the daily chart is reporting bearish conditions. The drop seen on Monday and Tuesday has marked an end of the recent bounce from 1.0727 and looks to have opened the doors for a re-test of that level.
A move below the lower band, currently at 1.0835 on the 15-min chart, would confirm a range breakdown and will likely yield a drop below 1.08. On the other hand, a move above the upper band placed at 1.0834 would shift risk in favor of a rise toward 1.0860 and possibly to 1.09.
15-min chart
Trend: Neutral
Technical levels
