- Silver prints three-day winning streak, stays positive above 50-day EMA.
- 61.8% Fibonacci retracement, 200-day EMA add to upside resistance.
- A three-week-old support line follows 50% Fibonacci retracement as support.
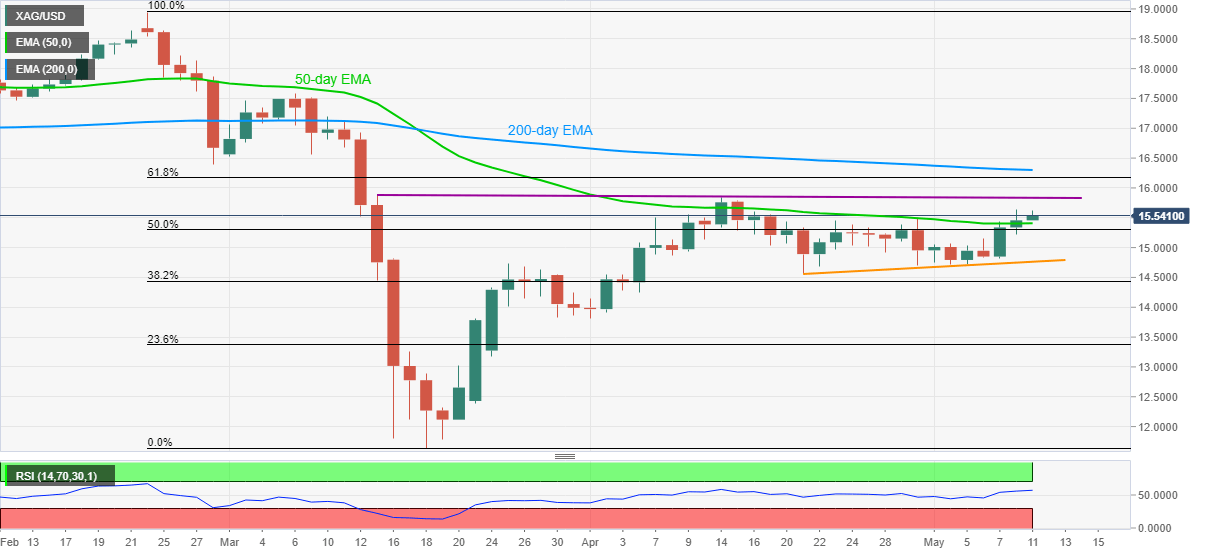
Having successfully breached 50-day EMA, Silver prices take the bids near $15.54, up 0.56% on a day, during early Monday.
Considering the normal RSI conditions, as well as a sustained break above the near-term key resistance, the white metal is rising toward a falling trend line from March 13, currently around $15.85.
However, the bullion’s further upside is likely to be questioned by 61.8% Fibonacci retracement of February-March fall and 200-day EMA, respectively near $16.17 and $16.30.
Meanwhile, a downside break below the 50-day EMA level of $15.40 may take a rest on a 50% Fibonacci retracement level of $15.30 ahead of visiting short-term support line close to $14.75.
If at all silver prices remain pressured below $14.75, the April month low near $13.80 could lure the sellers.
Silver daily chart
Trend: Bullish
