- USD/CNH drops below 61.8% Fibonacci retracement in the latest fall.
- Weekly support line holds the key to the late-April bottom.
- 200-HMA, 50% of Fibonacci retracement limits immediate upside.
USD/CNH bounces off intraday low of 1.0840 to 1.0875, but still down 0.12% on a day, amid the early Chinese session on Monday.
Read: PBOC: Will resort to “more powerful” policies to counter the coronavirus hit to growth
The pair recently slipped below 61.8% Fibonacci retracement of its April 30 to May 04 fall, which in turn drags it to the weekly support line, currently around 7.0775.
Given the MACD teasing bears, the quote’s further declines below 7.0775 can recall the April 30 low surrounding 7.0525.
On the contrary, an upside clearance of 61.8% Fibonacci retracement level of 7.0922 can trigger recoveries towards a two-day-old resistance line, at 7.0895.
Though, a confluence of 200-HMA and 50% Fibonacci retracement seems to limit the pairs’ further upside around 7.1050.
USD/CNH hourly chart
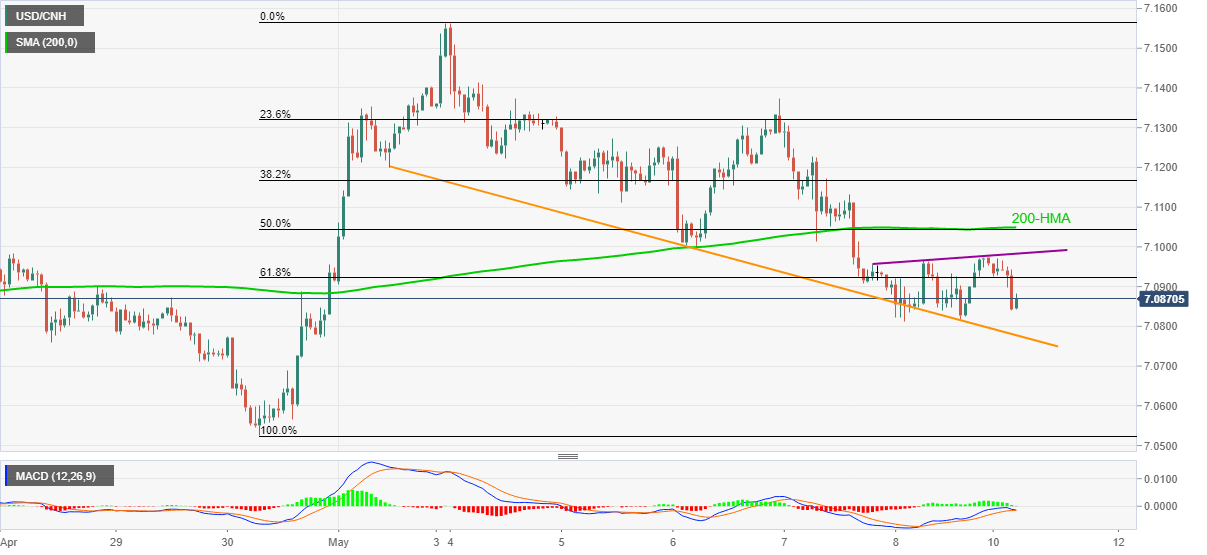
Trend: Bearish
