- XAU/USD continues to fluctuate in a tight range on Tuesday.
- RSI indicator on the daily chart stays flat near 50.
For the second straight day on Tuesday, the XAU/USD pair is having a difficult time setting a near-term direction. After dropping to a daily low of $1,693 during the Asian session, the troy ounce of the precious metal rose steadily but failed to hold above $1,710. As of writing, XAU/USD was up 0.33% on the day at $1,703.
XAU/USD technical outlook
On the daily chart, the RSI indicator stays flat near 50, confirming the pair’s indecisiveness. Meanwhile, the pair remains on track to close below the 20-day SMA for the third straight in a row, suggesting that buyers are struggling to take control of the price action.
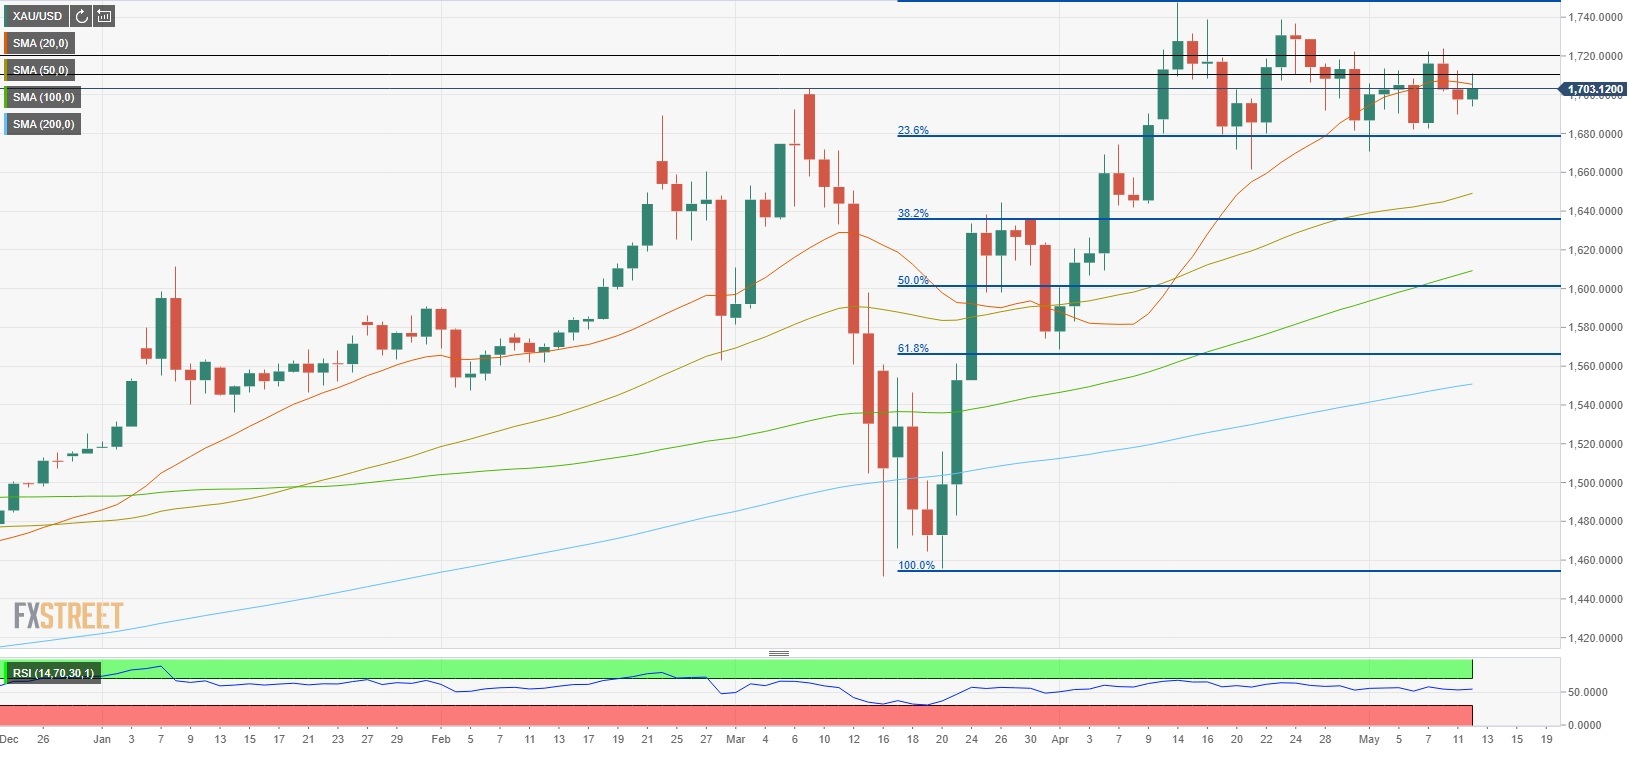
$1,710 (20-day SMA) area aligns as the first short-term resistance ahead of the next hurdle at $1,720. If XAU/USD successfully clears those resistances, it could aim for $1,750 (multi-year highs) but this seems unlikely without a fundamental catalyst.
On the downside, a strong support seems to have formed at $1,680 (Fibonacci 23.6% retracement of Mar. 20 – April 14 rally). Only a daily close below that level could cause the bearish pressure to build up and drag XAU/USD toward $1,660 (Apr. 21 low) and $1,647 (50-day SMA).
XAU/USD daily chart
 Additional technical levels
 Additional technical levels
