- USD/JPY takes a U-turn from seven-week low, refreshes intraday low.
- MACD turns bullish for the first time in six weeks.
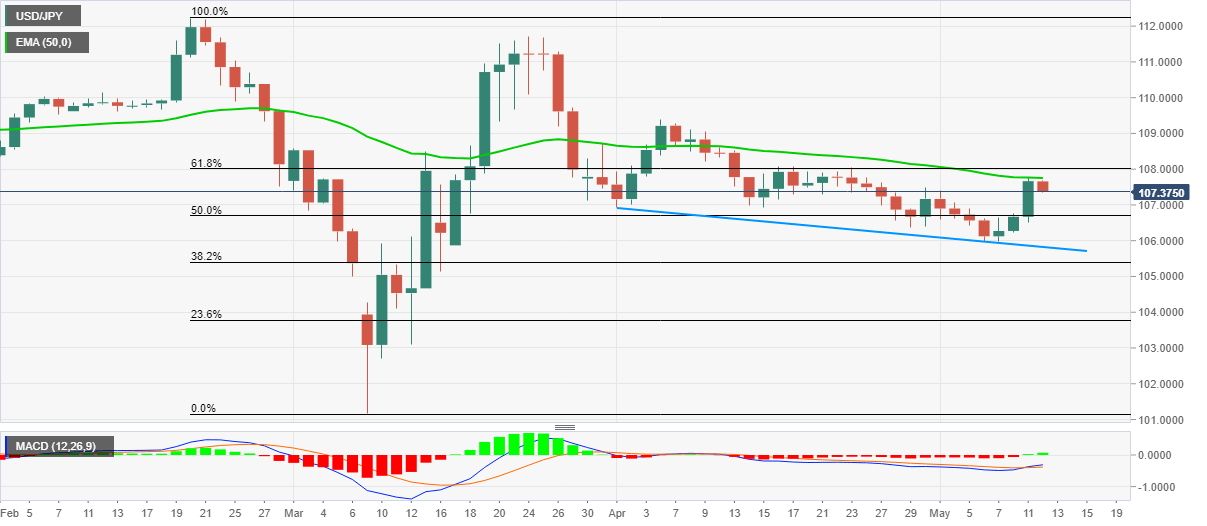
- 61.8% of Fibonacci retracement offers additional resistance.
With the risk-off at full stream, USD/JPY extends reversal from 50-day EMA while declining to the intraday low of 107.36 during early Tuesday. In doing so, the pair also ignores the first bullish MACD signals in over five weeks.
The quote currently seems to decline towards 50% Fibonacci retracement level of February-March fall, around 106.70. Though, 107.00 round-figure might offer an intermediate halt during the declines.
It should, however, be noted that a falling trend line from April 01, currently around 105.80, can challenge bears past-106.70.
On the upside, 61.8% Fibonacci retracement level of 108.00 can question the buyers above 50-day EMA level of 107.75.
USD/JPY daily chart
Trend: Further downside likely
