- US Dollar Index (DXY) is nearing the May highs.
- The level to beat for bulls is the 110.40 resistance.
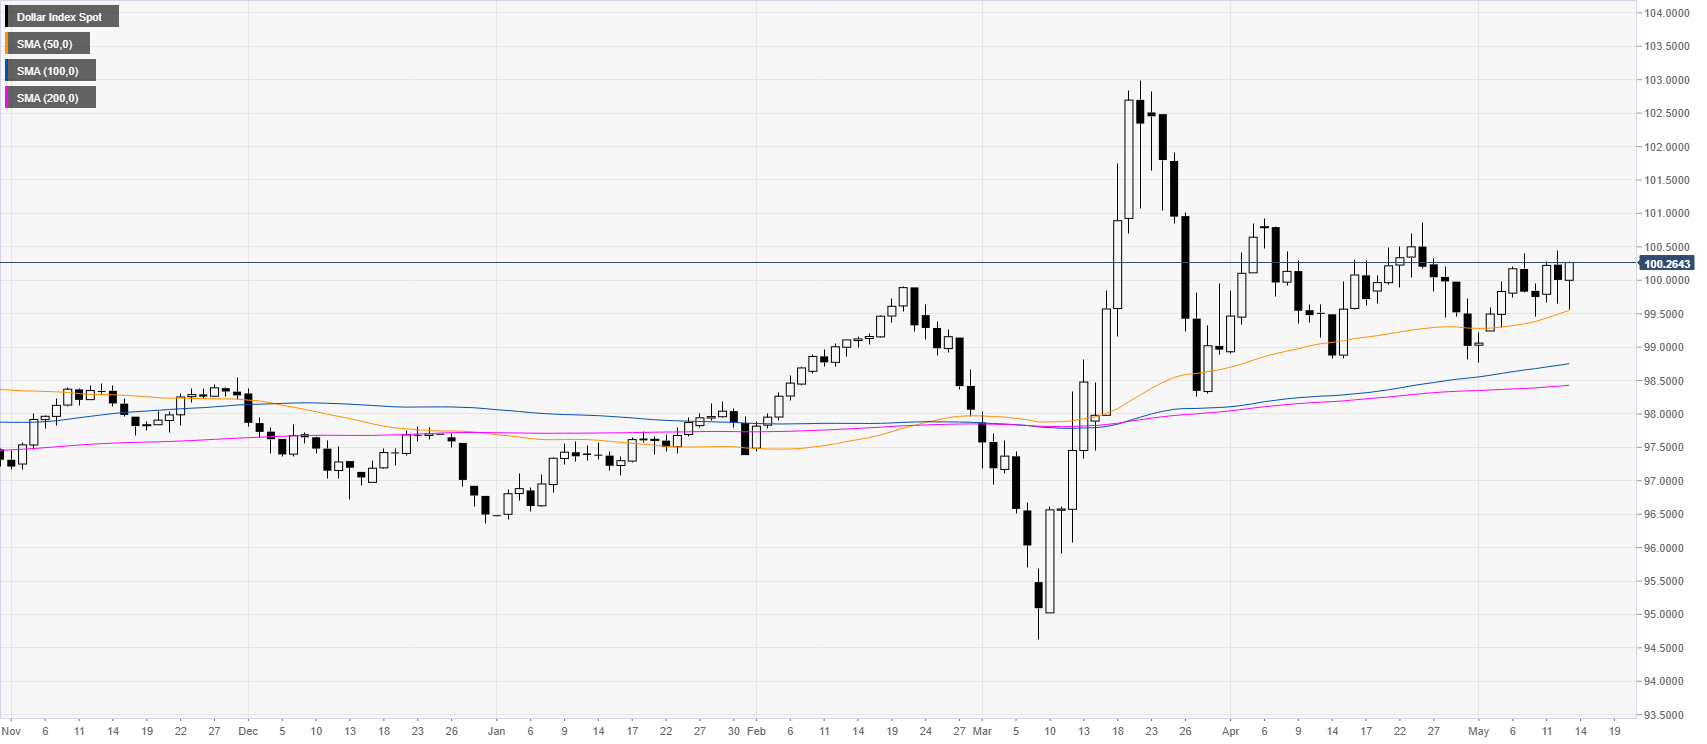
DXY daily chart
The US Dollar Index (DXY) index is stabilizing around the 100.00 mark while trading above its main SMAs on the daily time-frame suggesting an overall upward bias.
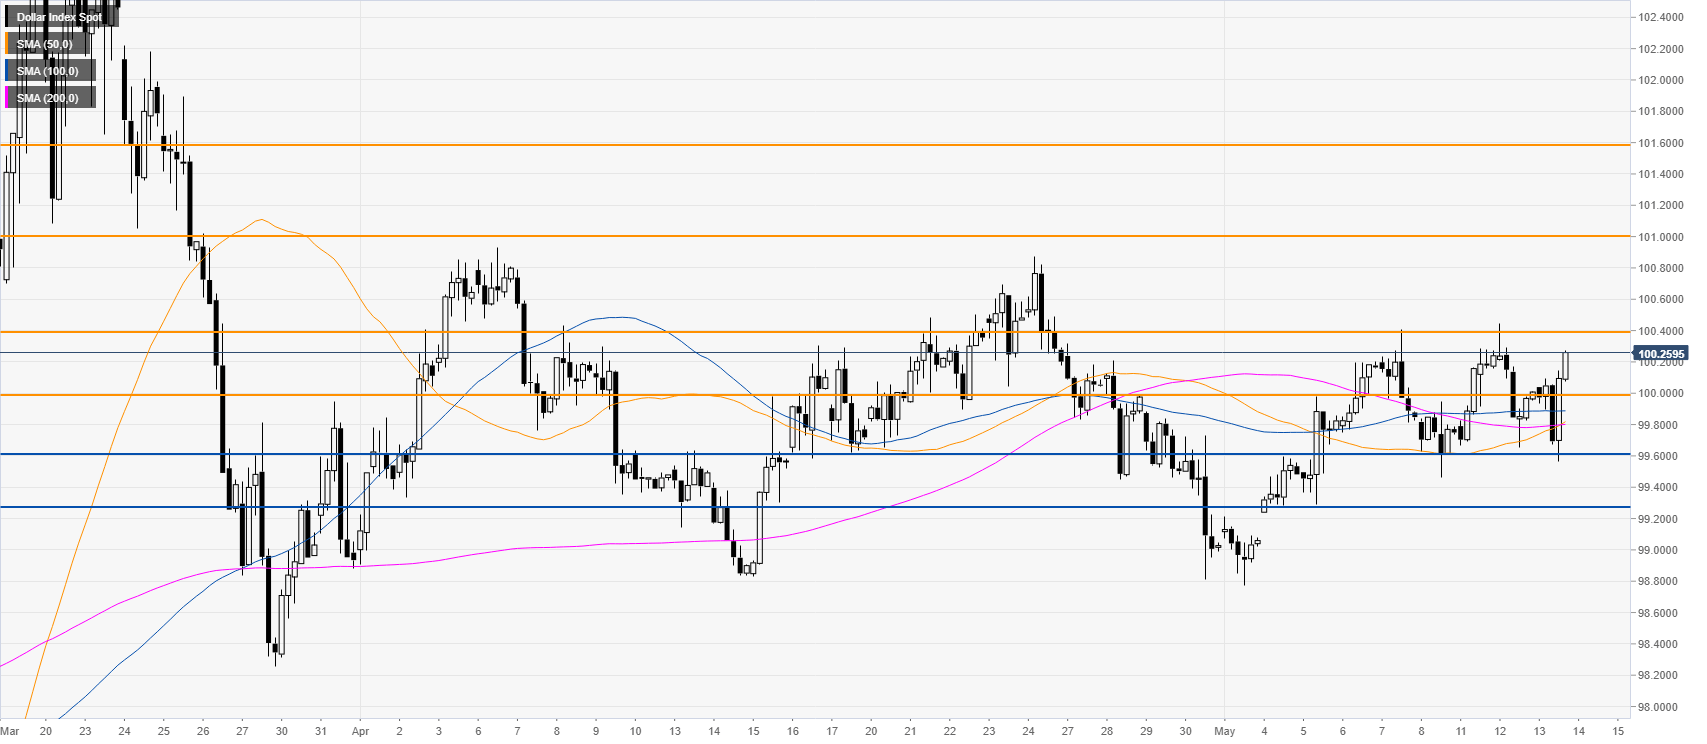
DXY four-hour chart
DXY is en route towards the May highs near the 100.40 resistance while the market is trading above the main SMAs on the four-hour chart. A break above the level should lead to more advances with the 101.00 next on the bulls’radar. On the flip side, support is expected to hold near the 100.00 and the 99.60 levels.
Additional key levels
