- USD/CAD pulls back from the weekly high, fails to extend gains beyond 200-bar SMA.
- A short-term falling triangle, six-week-old resistance line restrict the pair’s near-term upside.
- The April month lows become the key support.
USD/CAD recovers from 1.4055 to 1.4075 during Wednesday’s Asian trading session. Even so, the pair prints 0.04% loss on a day while also struggling to extend the break of 200-bar SMA.
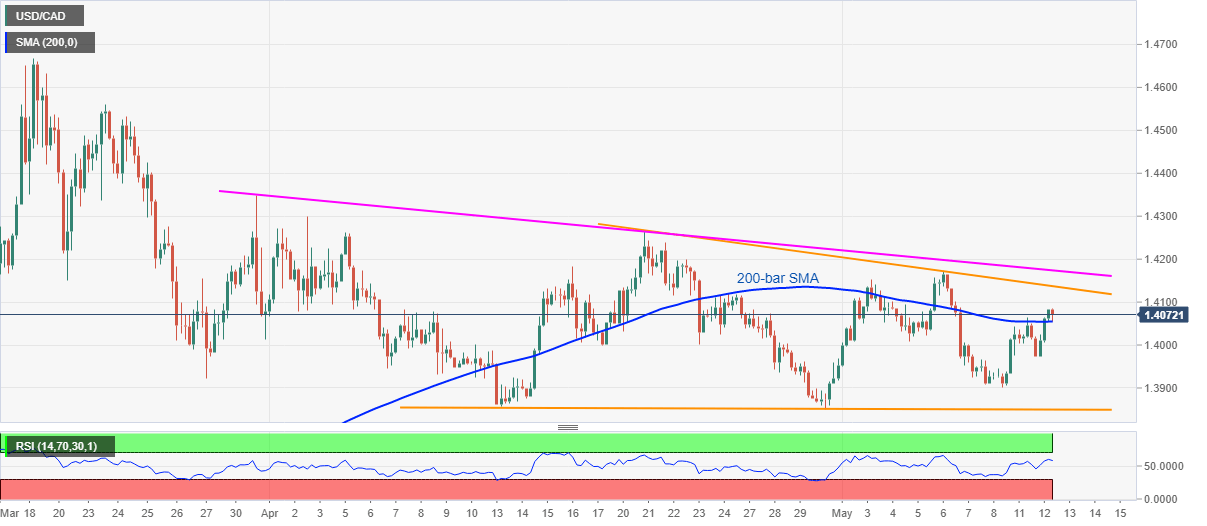
Given the sustained break of 200-bar SMA, the quote is likely to challenge the resistance line of an immediate falling triangle formation, around 1.4140.
Though, a downward sloping trend line from March 31, could offer an additional upside barrier, close to 1.4175, during the further run-up.
If at all the buyers manage to cross 1.4175, April top near 1.4265 will be on their radars.
Meanwhile, pair’s declines below 200-bar SMA level of 1.4055 could drag it back to the triangle’s support, also comprising April month low, near 1.3850/55.
USD/CAD four-hour chart
Trend: Further recovery expected
