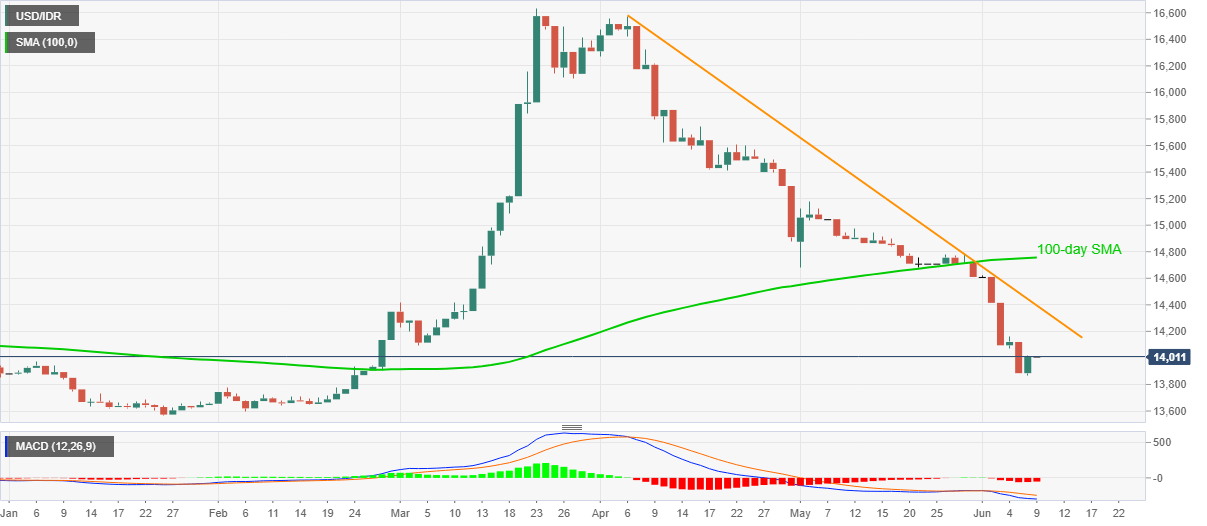
- USD/IDR extends recovery moves from 13,870, the lowest since late-February.
- Bearish MACD, sustained trading below key trend line keeps sellers hopeful.
- 100-day SMA adds to the upside barriers beyond two-month-old resistance line.
USD/IDR carries the previous day’s bounce off three-month low while trading around 14,011 amid the early Tuesday’s trading.
Even so, bearish MACD signals and the pair’s sustained trading below a falling trend line since April 06 favor the sellers unless the quote crosses 14,395 on a daily basis.
Additionally, the 100-day SMA level of 14,755 is an extra check during the USD/IDR pair’s further recovery.
Meanwhile, the pair’s declines below Monday’s low of 13,870 could fetch the quote to February high of 13,775.
Though, the yearly low near 13,570, followed by 13,000 round-figure could challenge the bears afterward.
USD/IDR daily chart
Trend: Bearish
