- Gold prices seesaw around the highest in over a week.
- A sustained break above 18-day-old falling trend line, MACD signals favor the buyers.
- 50-day SMA, monthly low can lure the bears during the declines below $1,732.
Gold prices step back from the highest since June 02 while declining to $1,736 during the initial hours of Thursday’s Asian session. In doing so, the yellow metal seems to trim the US Fed-led gains. Nonetheless, the precious metal carries the upside break of a short-term resistance line, now support, together with the MACD histogram conmditions that dim the prospects of the bullion’s further downside.
As a result, the buyers may keep targeting to refresh the monthly high of $1,745.12 while meeting $1,750 round-figures. Though, the metal’s further upside might be questioned by the May month high near $1,765.
In a case where the bulls keep the reins above $1,765, the rush to risk-safety could gain additional ammunition to challenge the late-2012 top and aim for $1,800 mark.
Alternatively, a downside break of the resistance-turned-support, currently near $1,732, can fetch the quote towards meeting $1,700 and then the 50-day EMA level of $1,696.50. However, any more declines by the safe-haven may have to refresh the monthly low of $1,670.76 to please the bears.
Gold daily chart
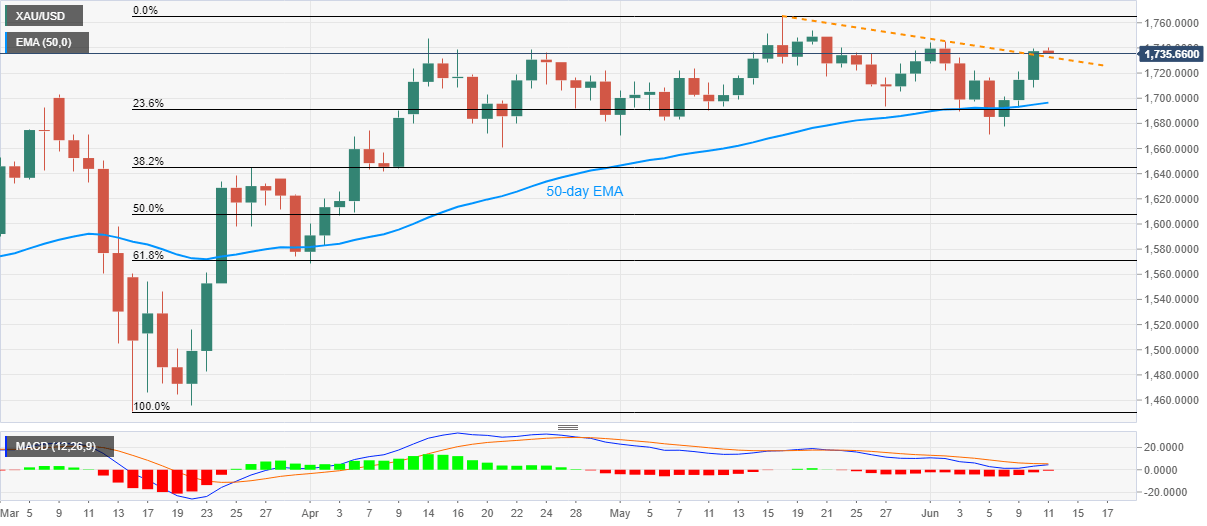
Trend: Bullish
