- GBP/USD looks for a firm direction near one-week low.
- A downside break of 200-day EMA, RSI conditions keep the sellers hopeful.
- A confluence of 100-day EMA and 61.8% Fibonacci retracement question the bears.
- UK’s April month Industrial Production, GDP decorate the economic calendar.
Having slipped to the lowest since June 04, GBP/USD seesaws around 1.2580 during Friday’s Asian session. The Cable bears seem to catch a breather after the previous day’s heavy fall ahead of the key US data.
Read: UK GDP Preview: A 20% plunge could serve as a third blow to sterling, three scenarios
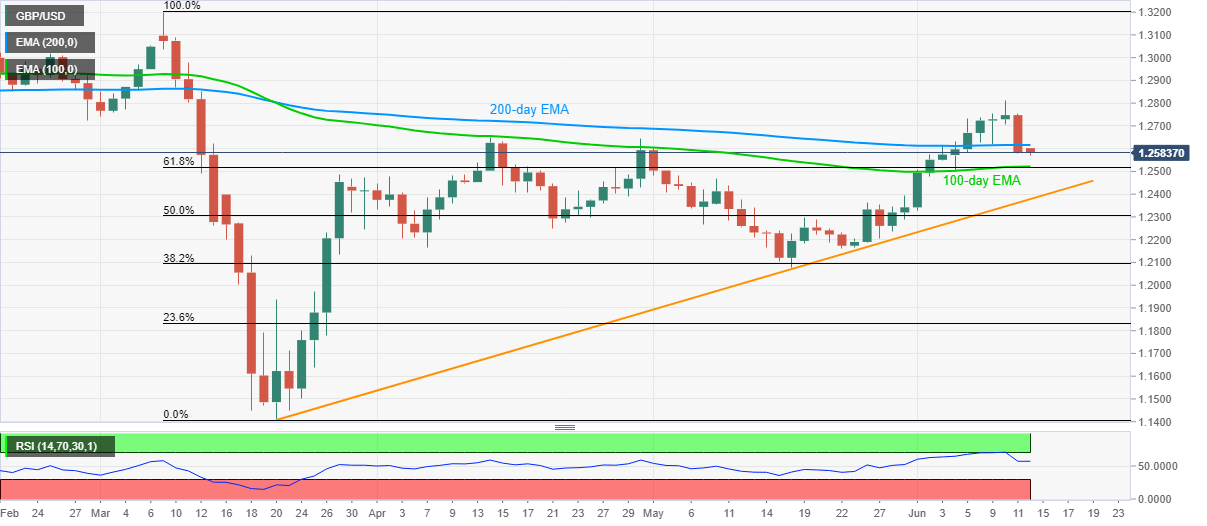
However, the pair’s sustained trading below 200-day EMA, as well as an absence of oversold RSI, directs the sellers towards a confluence of 100-day EMA and 61.8% Fibonacci retracement of March month’s fall.
Should the GBP/USD prices remain weak below 1.2520/15 support, an ascending trend line from March 20, around 1.2375, will be the key to watch.
On the upside, the pair’s breakout of 200-day EMA, at 1.2615 now, could attempt another rise to aim for 1.2800 and then to the monthly high near 1.2813. In doing so, February month low near 1.2725 might offer an intermediate halt during the run-up.
GBP/USD daily chart
Trend: Further weakness expected
