- AUD/USD portrays a short-term descending triangle inside one-week-old falling trend line.
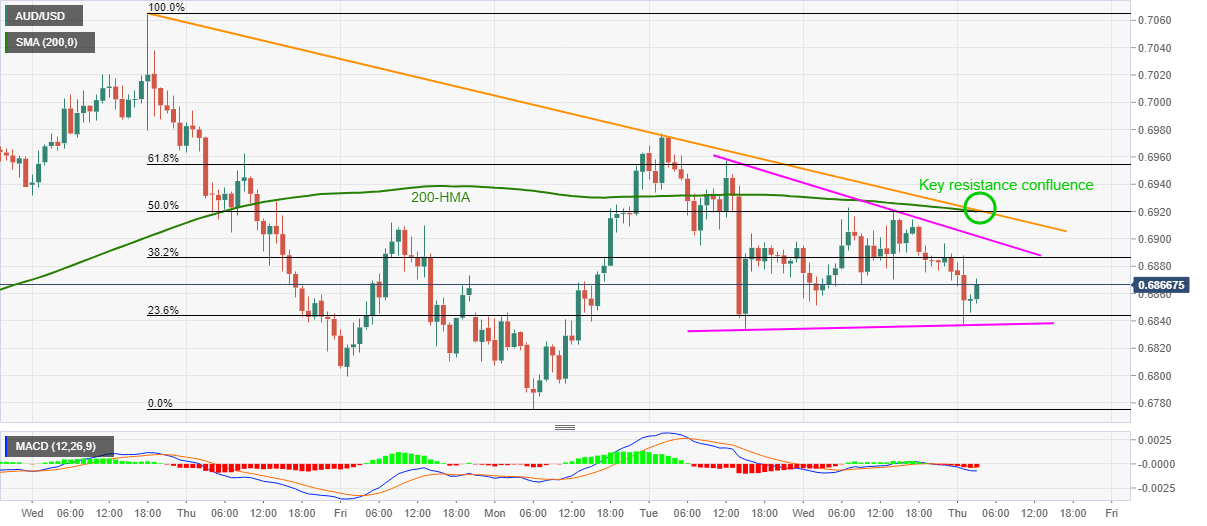
- A confluence of 200-HMA, weekly resistance line and 50% Fibonacci retracement offers near-term strong resistance.
- Weekly low holds the key to the pair’s further downside.
AUD/USD recovers from intraday low of 0.6837 to 0.6865 during the early Wednesday’s trading. Even so, the pair posts 0.28% losses on a day while favoring the bears for the third day in a row.
The Aussie pair’s latest U-turn highlights a short-term descending triangle for the buyers, which in turn gives rise to hopes of further upside. However, 200-HMA, 50% Fibonacci retracement of June 10-15 downside and a falling trend line from June 10 becomes a tough resistance on the upside.
As a result, the quote’s upside break of the said triangle’s resistance, currently around 0.6905, needs validation from 0.6920 key barrier to challenge the weekly top near 0.6975.
Alternatively, a downside break below 0.6835 could refresh the week’s bottom while thrashing the current trough close to 0.6775.
AUD/USD hourly chart
Trend: Pullback expected
