- USD/ZAR seesaws in a choppy range between 17.15 and 17.22.
- 21-day EMA guards the immediate upside above 50% Fibonacci retracement level.
- February month high can lure the bears below 61.8% of Fibonacci retracement.
USD/ZAR takes rounds to 17.18 during the early Asian session on Thursday. The pair fails to extend the pullback from 61.8% Fibonacci retracement of February-April upside. The reason is 21-day EMA that guards the pair’s immediate rise.
As a result, the quote’s declines to 50% Fibonacci retracement level of 17.00 become well anticipated. However, June 10 high of 16.67 might offer an intermediate halt before dragging the quote back to 16.46 mark comprising 61.8% Fibonacci retracement level.
In a case where the bears dominate past-16.46, the February month top close to $15.85 will return to the charts.
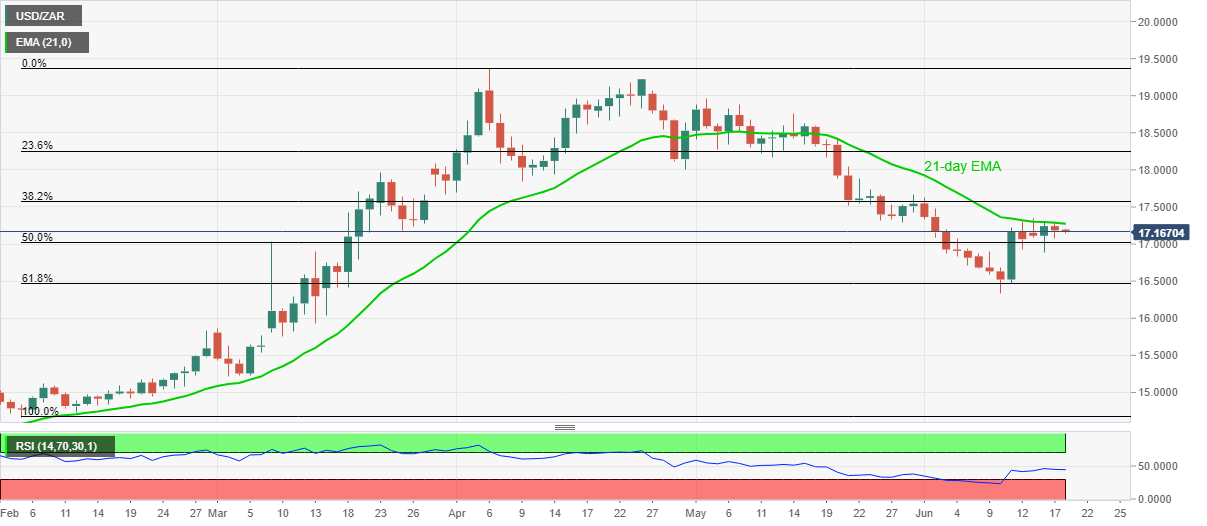
Meanwhile, an upside clearance of 21-day EMA, at 17.27 now, can propel the quote towards May 29 high near 17.67. Though, April 30 bottom close to 18.00 could challenge the bulls afterward.
USD/ZAR daily chart
Trend: Pullback expected
