- WTI extends recoveries from $37.41 to probe the weekly top above $39.00.
- Confirmation of a bullish chart pattern favors the buyers.
- RSI conditions might offer a bumpy road ahead.
WTI takes the bids near $39.25, intraday high of $39.28, during the initial Asian session on Friday. The oil benchmark recently crossed a falling trend line from June 07, which in turn asserts the upside favoring technical pattern, namely inverse head-and-shoulders.
As a result, the black gold it’s likely to extend the latest rises towards $40.00 round-figure before challenging the monthly top surrounding $40.60.
In a case where the oil prices remain strong beyond $40.60, irrespective of nearly overbought RSI conditions, the bulls might not hesitate to challenge early-March low around $41.20.
Meanwhile, a downside break below the resistance-turned-support line of $38.85 could aim for a $37.50/40 re-test, a break of which will defy the bullish chart formation.
Though, $37.20, $36.50 and the weekly low near $34.65/60 might offer intermediate halts to the sellers during further weakness.
WTI four-hour chart
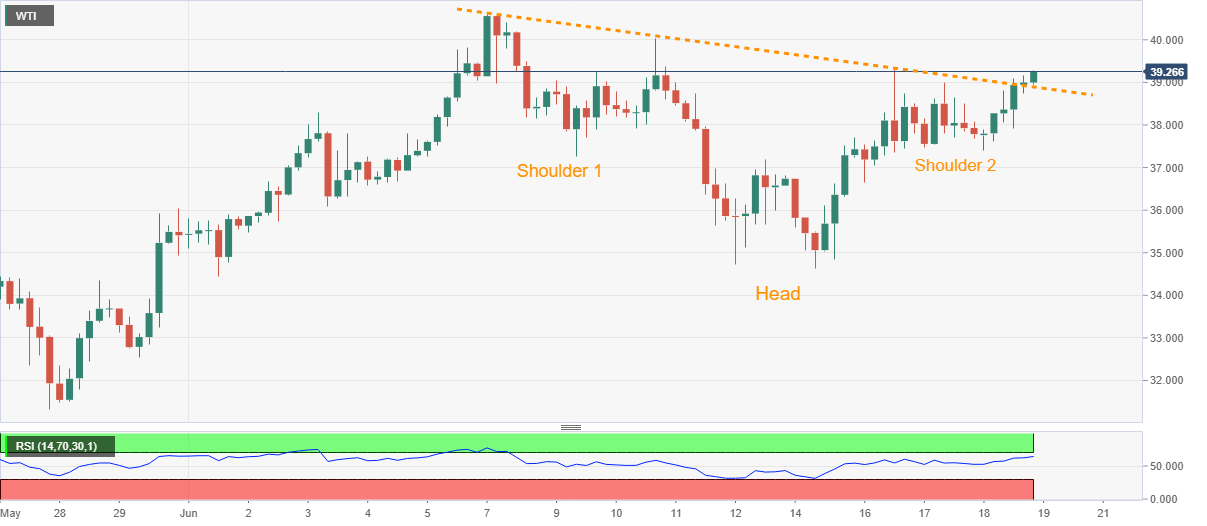
Trend: Bullish
