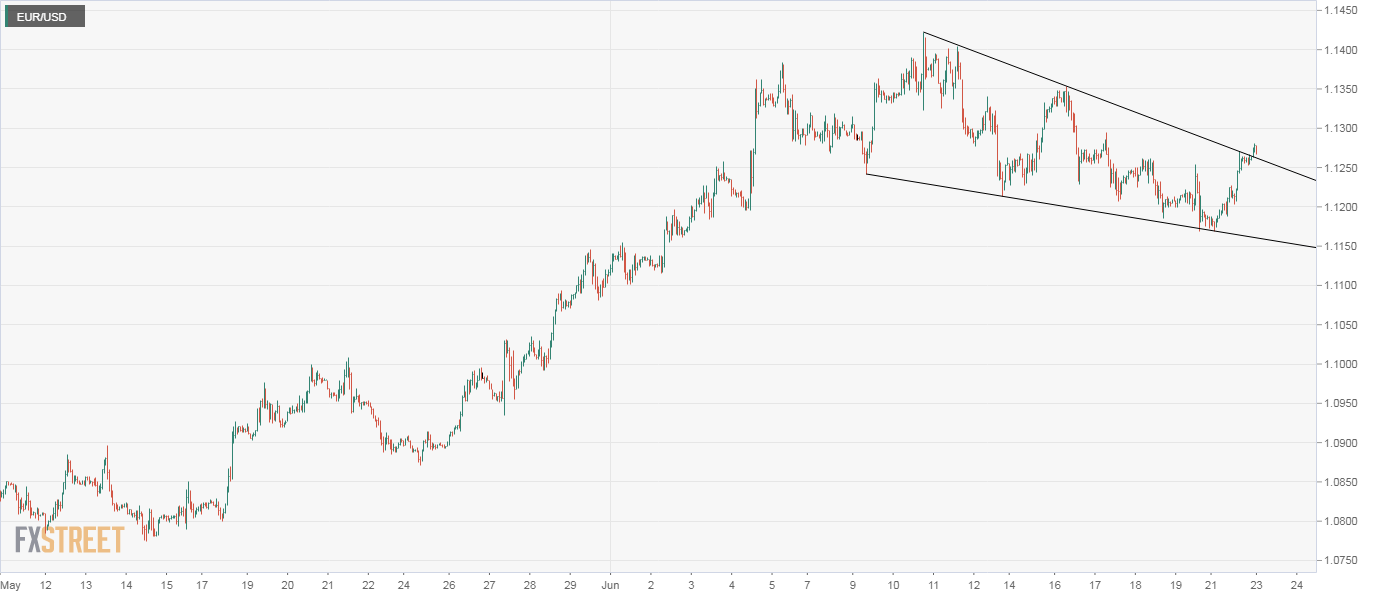
- EUR/USD hourly chart shows a falling wedge breakout, a bullish reversal pattern.
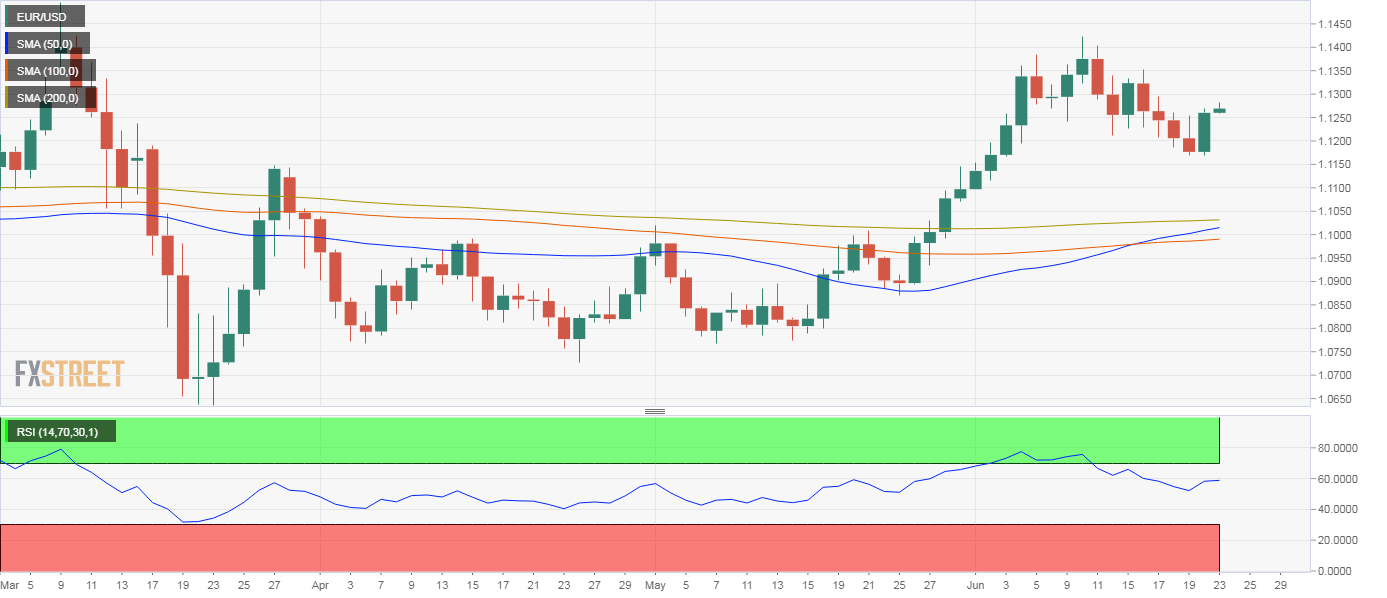
- Daily chart indicators are biased bullish and validate the breakout seen on the hourly chart.
EUR/USD jumped to 1.1280 during Tuesday’s Asian session, extending Monday’s 0.78% gain and confirming a falling wedge breakout on the hourly chart.
A falling wedge comprises converging trendlines connecting lower highs and lows. The converging nature of trendlines indicates bearish exhaustion. Hence, a breakout is considered a bullish reversal pattern.
Put simply, EUR/USD’s falling wedge breakout indicates that the pullback from the June 10 high of 1.1422 has ended and the rally from the May 14 low of 1.0775 has resumed. The wedge breakout is backed by an above-50 reading on the 14-day relative strength index, a bullish cross of the 50- and 100-day simple moving averages (SMAs), and an impending golden cross of the 50- and 100-day SMAs.
The pair may face resistance at 1.1353 (June 16 high), which, if breached, would expose 1.1422.
The bullish bias would weaken if the pair finds acceptance under Monday’s low of 1.1168. At press time, the pair is trading at 1.1268.
Hourly chart
Daily chart
Trend: Bullish
Technical levels
