- GBP/JPY ignores the break to four-day losing streak, reverses from 133.72.
- Bearish MACD, U-turn from the key resistances direct sellers towards 50% Fibonacci retracement.
- 100-day SMA adds to the upside barriers beyond near-term resistance line.
GBP/JPY slips below 133.00, intraday low of 132.93, down 0.22% during the early Tuesday. The pair’s latest weakness could be attributed to its failure to cross the 50-day SMA and a falling trend line from June 08 amid bearish MACD signals. As a result, the quote defies the previous day’s recovery moves from 50% Fibonacci retracement level of March-June upside.
While the pair’s latest declines aim to revisit 50% Fibonacci retracement level of 131.90, Monday’s low near 131.75 might challenge the bears before they aim for 130.00 threshold comprising 61.8% Fibonacci retracement.
During the quote’s further weakness past-130.00, May month bottom surrounding 129.32 will be on the bear’s radars.
Alternatively, an upside clearance of a 50-day SMA level of 133.45 will confront the said resistance line around 133.70. Though, a clear break above 133.70 will propel the quote towards 100-day SMA, at 135.08 now.
GBP/JPY daily chart
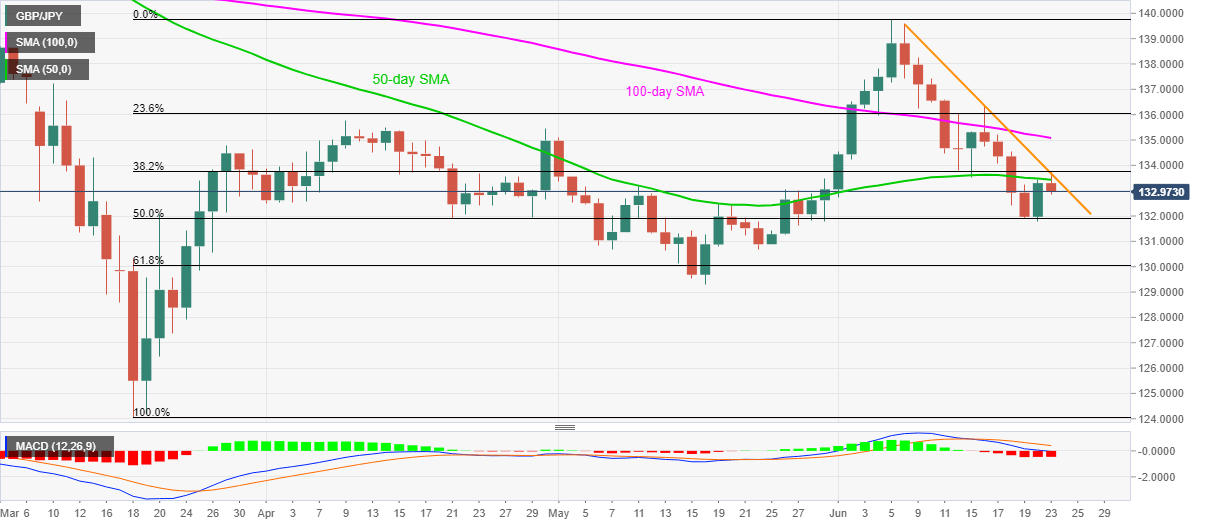
Trend: Further weakness expected
