- GBP/USD remains on the front-foot near the three-day high.
- A falling trend line from June 10, 200-HMA challenges further upside amid overbought RSI.
- Friday’s top can offer immediate support during the U-turn.
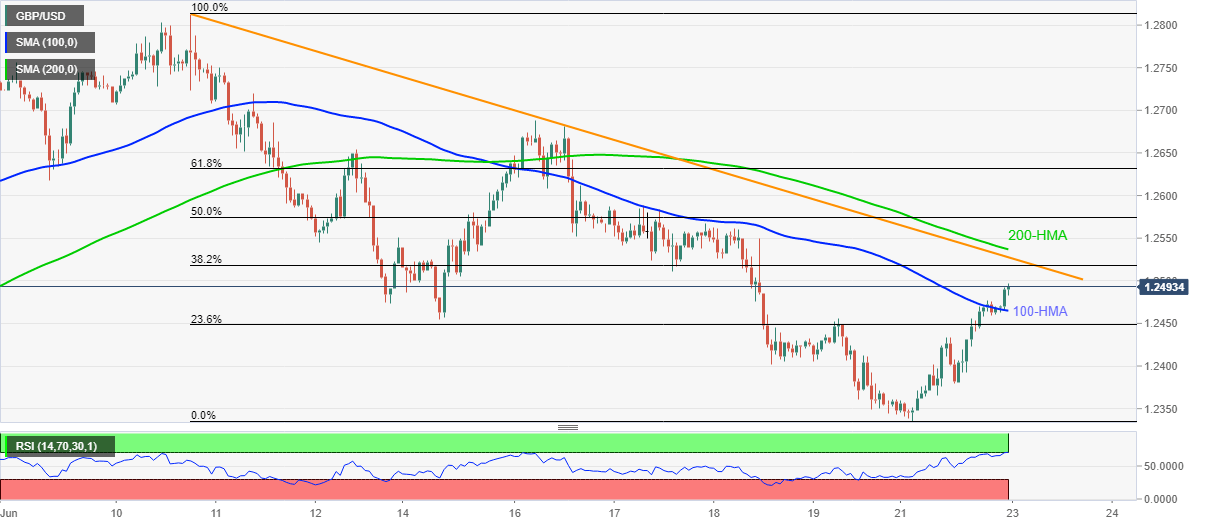
GBP/USD takes the bids near 1.2495 during the early-Tuesday morning in Asia. The pair recently broker 100-HMA, which in turn enables it to head towards a two-week-old resistance line.
In addition to 1.2527 trend line resistance, a 200-HMA level of 1.2537 could also add upside barriers for the pair. It’s worth mentioning that RSI conditions suggest a pullback from the key resistances.
If buyers refrain from respecting the 200-HMA resistance, needless to mention about overbought RSI, 61.8% Fibonacci retracement of June 10-22 fall near 1.2630 will be on their radars.
On the contrary, the pair’s falling below the 100-HMA level of 1.2465 could fetch it to Friday’s top near 1.2455. Though, the pair’s further downside could aim for 1.2400 round-figure.
Furthermore, Monday’s low near 1.2335 and the monthly bottom around 1.2325 are extra supports to watch in a case the quote dwindles further below 1.2400.
GBP/USD hourly chart
Trend: Pullback expected
