- WTI eases from one week high after flashing a bearish candlestick the previous day.
- An ascending trend line from May 28 appears on the sellers’ radar.
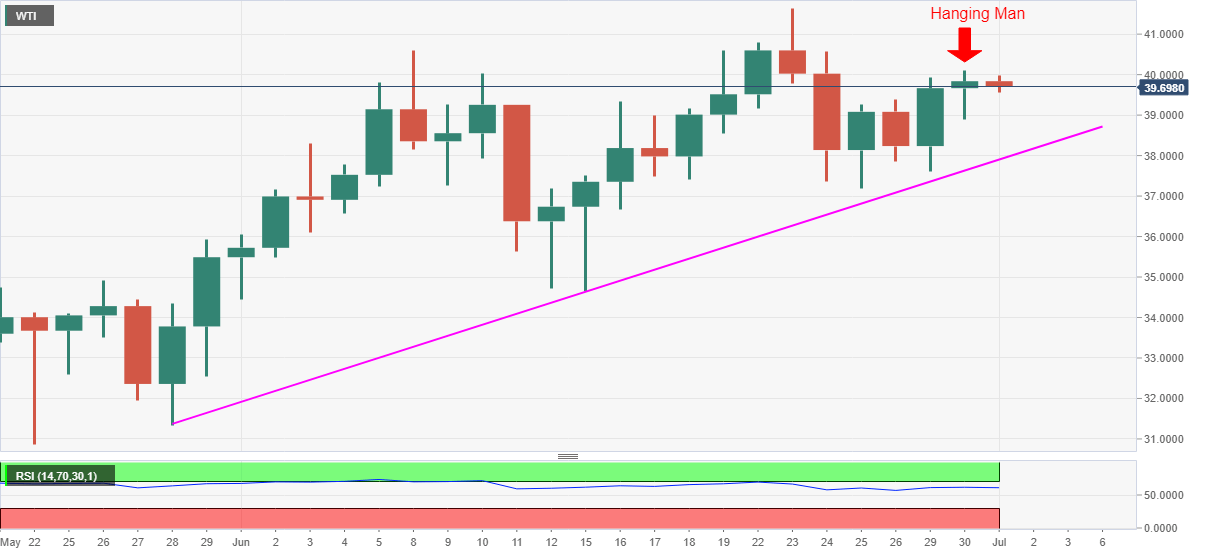
- June month’s top adds to the upside barrier beyond $40.10.
WTI steps back from weekly highs to $39.69 amid the initial Tokyo session trading on Wednesday. The black gold’s recent weakness justifies Tuesday’s bearish candlestick formation on the daily chart.
Hence, sellers are currently targeting a re-test to the five-week-old support line, at $37.90, during the further declines. However, a $39.00 round-figure is expected to offer immediate rest to the energy benchmark.
If at all the bears dominate past-$37.90, the mid-June low near $34.70 and May 28 bottom surrounding $31.30 could return to the charts.
On the flip side, a clear break above the previous day’s high near $40.10 will defy the candlestick formation and trigger the commodity’s recovery moves towards June 08 top near $40.60 ahead of challenging the last month’s peak close to $41.65/70.
Other than the technical details, oil traders will also keep eyes on the weekly readings of the US Crude Oil Stocks Change, expected -0.95M versus 1.442M prior, published by the Energy Information Administration (EIA).
WTI daily chart
Trend: Pullback expected
