- AUD/USD seesaws around a three-week-old resistance line.
- Bulls eye a clear break above 0.6945 to attack a 12-day-old horizontal resistance.
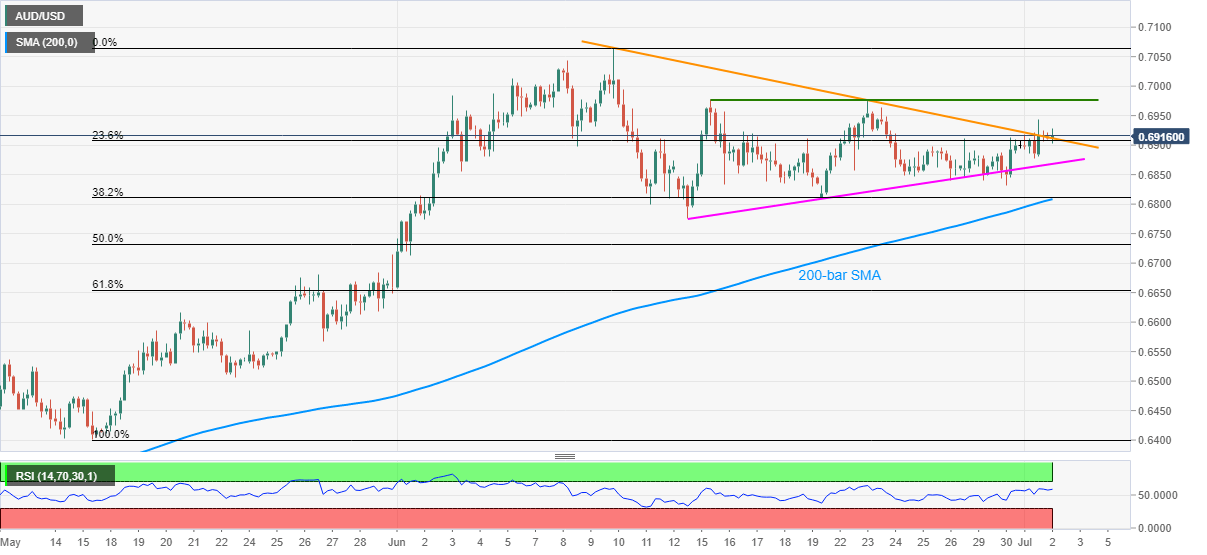
- A short-term rising support line, 200-bar SMA could question immediate downside.
AUD/USD fails to sustain the pullback from 0.6903 beyond 0.6921 as it currently declines to 0.6913 during the early Thursday. In doing so, the aussie pair takes rounds to a falling trend line resistance stretched from June 10. However, the quote’s latest recovery and sustained trading beyond 200-bar SMA keeps the buyers hopeful.
It’s worth mentioning that the strong RSI conditions, below the overbought region, increases the odds of the pair’s further upside.
As a result, the optimists will look for a fresh intraday high above the current 0.6945 to target a horizontal area comprising highs marked on June 16 and June 23 around 0.6975/80.
Given the bulls’ capacity to cross 0.6980, 0.7000 threshold and the previous month’s high around 0.7065 could offer halts during the rise to 0.7100 round-figures.
On the flip side, an ascending trend line from June 15, at 0.6870 now, could offer immediate support in a case where the quote slips further below 0.6900. However, a confluence of 200-bar SMA and 38.2% Fibonacci retracement of May 15 to June 10 upside, near 0.6810, will question the bears afterward.
AUD/USD four-hour chart
Trend: Sideways
