- USD/INR’s daily chart shows bearish sentiment is quite strong.
- The pair could reverse the recent recovery from 3.5-month lows.
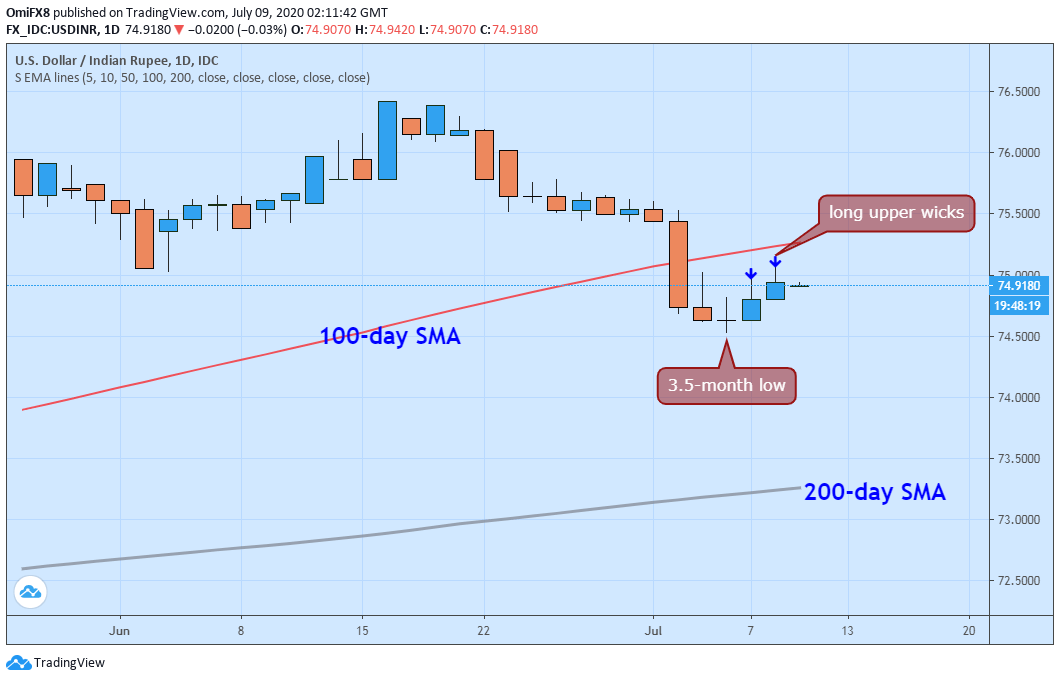
USD/INR rose to 75.00 on Wednesday, having printed a 3.5-month low of 74.5280 on Monday.
The bounce lacks conviction, as suggested by the long upper wicks attached to daily candles representing price action seen on Tuesday and Wednesday, and could be short-lived.
Long upper wicks are formed when buyers fail to keep prices at session highs and are indicative of bearish sentiment or sell on the rise mentality.
In addition, the hourly chart relative strength index (RSI) is reporting a double top breakdown, a sign the recovery from multi-month lows has ended.
The pair could revisit Monday’s low of 74.5280. Acceptance below that level would imply a continuation of the sell-off from highs near 76.40 observed in June and expose the 200-day simple moving average (SMA) support, currently at 73.25.
A close above the 100-day SMA at 75.265 would invalidate the bearish setup.
Daily chart
Trend: Bearish
Technical levels
