- GBP/USD fails to keep the week-start uptick to 1.2643.
- A bearish chart formation, MACD signals favor sellers.
- 1.2715 holds the key to the June month top.
GBP/USD drops to 1.2630 amid the early Monday morning in Asia. Even so, the Cable remains positive on a daily basis with around 0.10% gains. Though, a bearish chart pattern, the rising wedge, joins bearish MACD signals, question the bulls.
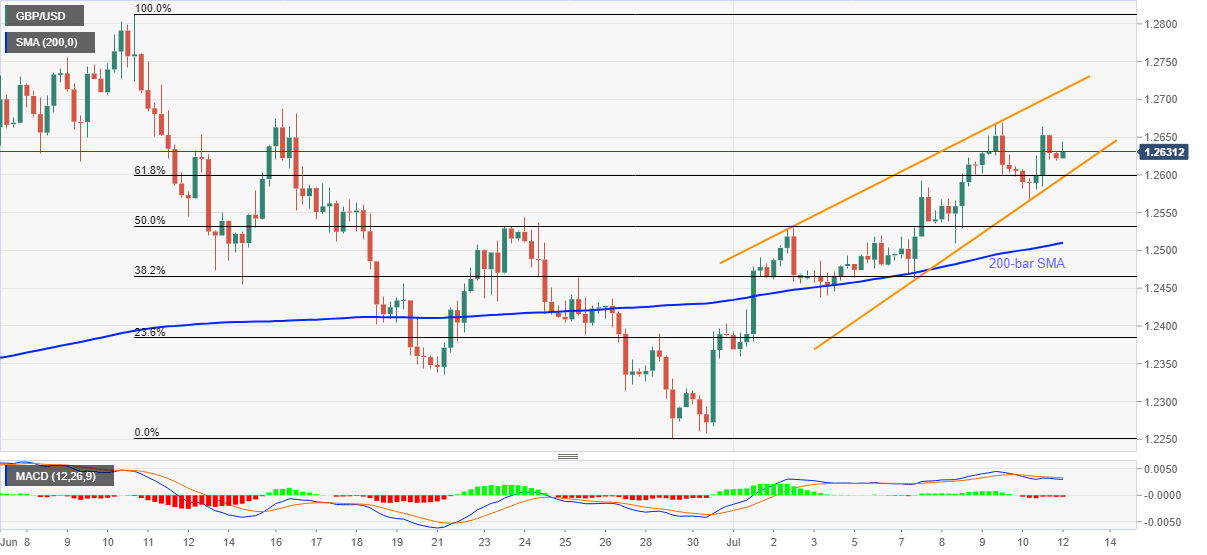
As a result, 1.2600 becomes the key for decision making as a downside break of the same will confirm the bearish formation. Also increasing the strength of the support is 23.6% Fibonacci retracement of June month declines from 1.2813 to 1.2251.
Even if the pair’s break of 1.2600 opens the door for its southward trajectory towards July 03 low near 1.2440, 200-bar SMA level of 1.2510 could offer intermediate halts during the quote’s declines.
Additionally, the GBP/USD bears’ dominance past-1.2440 can aim for June 22 low near 1.2335 and 1.2310 ahead of attacking the previous month’s low near 1.2250.
Meanwhile, 1.2690 can offer immediate resistance ahead of the said pattern’s resistance line, currently around 1.2715.
It should, however, be noted that the bulls’ ability to cross 1.2715 will not only defy the bearish chart formation but will also challenge June month’s peak surrounding 1.2815.
GBP/USD four-hour chart
Trend: Pullback expected
