- The S&P 500 is trading 1.58% higher on Wednesday.
- The key resistance level is at 3,233.25.
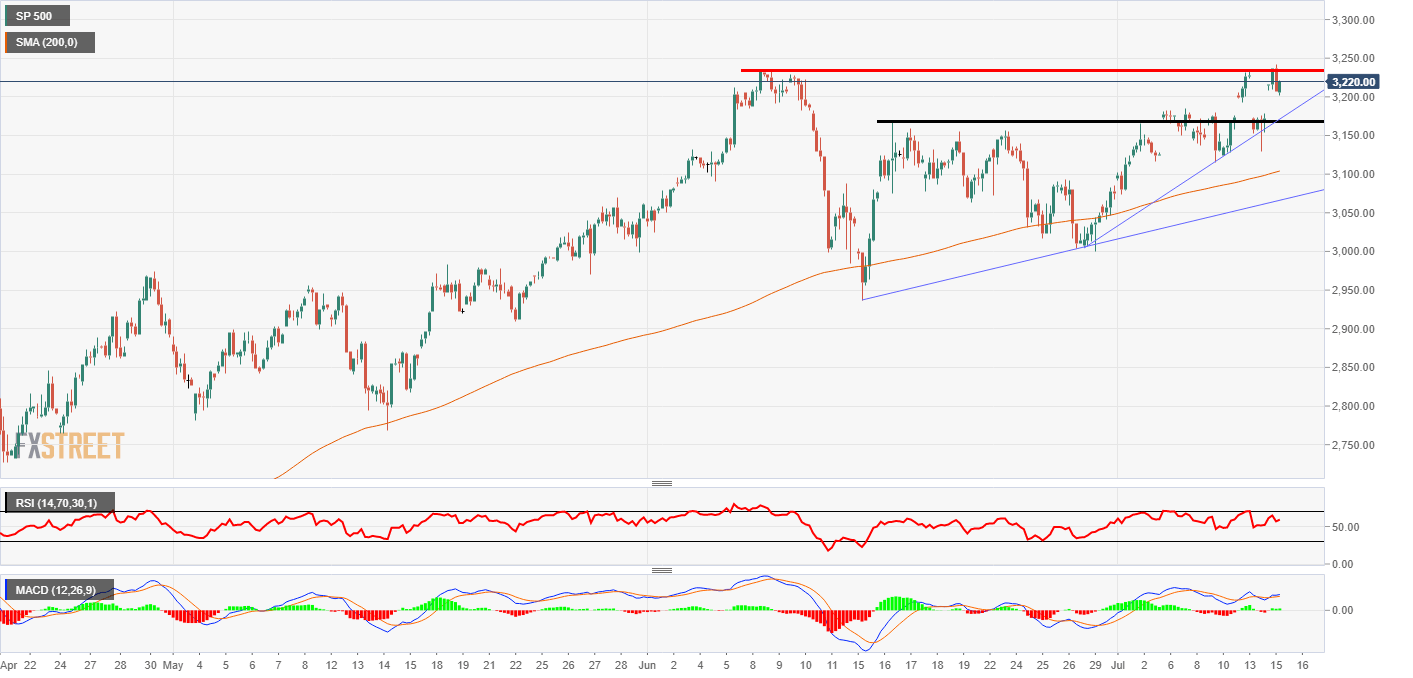
S&P 500 4-hour chart
The S&P 500 is at a critical level on Thursday and could break to a level not seen since 25th February. The price printed above the key resistance but did not manage to sustain the bullish momentum. This could take the index back to a level when it really started falling due to the COVID-19 pandemic.
Looking closer at the chart, there are some support levels on the downside at the purple trendlines and the black horizontal line near 3,167.50. The indicators are understandably bullish at the moment the Relative Strength Index is above 50 but has just moved away from the overbought area. This means there is still some more space for an upside move. The MACD signal lines are above the zero level and the histogram is also green.
Looking at the higher timeframe there is a gap that could be a resistance zone at 3,328.45. This was a gap from one of the weekends where the coronavirus news really took its toll around 21st February. Beyond that, we could be back at the all-time highs of 3,353.92. In terms of outperformers, the travel companies are at the top of the leaderboard. Royal Caribean Cruises (NYSE:RCL) and Norwegian Cruise Lines (NYSE:NCLH) are both above 15%.
Additional levels
