- USD/JPY trims early-day gains from 107.54, still near eight-day top.
- MACD teases the bulls, monthly support line adds favors to the buyers.
- Current month’s top, 200-day SMA become the key resistances.
USD/JPY recedes from 107.54 to 107.30, up 0.26% on a day, during the pre-European session on Monday. The yen pair recently bounced off an eight-day top due to another failure to cross 100-day SMA.
Even so, the MACD signals refrain from supporting the bears while the pair’s sustained trading beyond a one-month-old support line also portrays the underlying momentum strength.
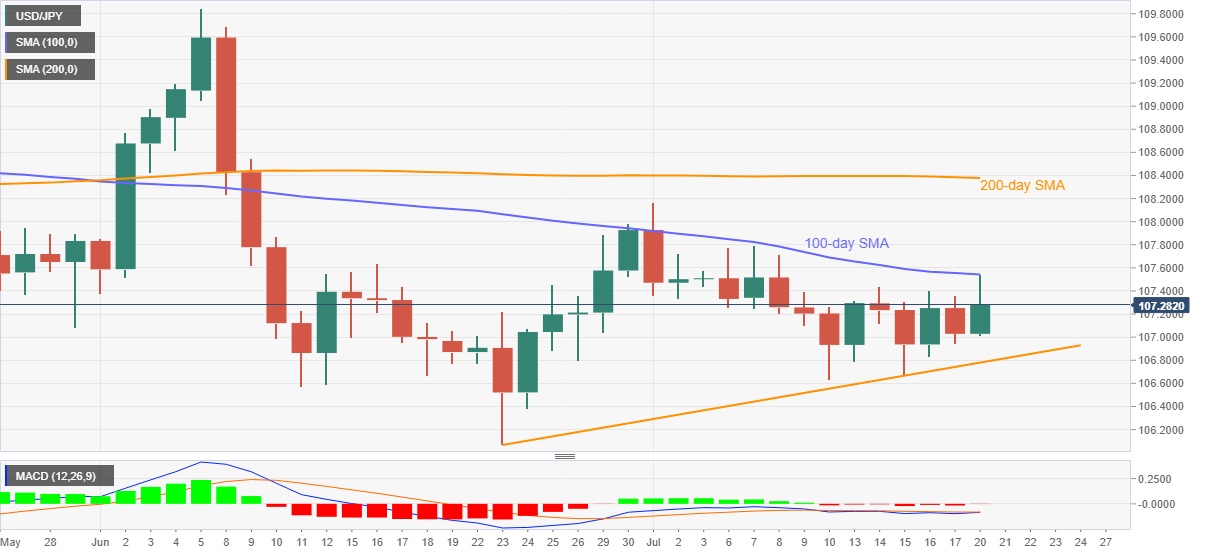
Hence, bulls may again confront with 107.54 resistance level, comprising 100-day SMA, to aim for 107.80 and the monthly peak close to 108.17. Though, 200-day SMA around 108.40 will be the tough nut to crack for buyers afterward.
Meanwhile, a downside break of the said support line, at 106.78 now, may find 106.50 and June 23 bottom around 106.05 as follow-on rest-points. However, the pair’s sustained weakness past-106.00 can recall the March 06 low near 105.00 on the charts.
USD/JPY daily chart
Trend: Further recovery expected
