EUR/USD has stabilized above 1.17 after surging to the highest since September 2018. The common currency continues benefiting from the EU recovery fund agreement and also the upbeat German IFO figures reported earlier in the week. On the other side of the pond, talks about the next fiscal stimulus package in the US are moving at a slow pace.
As tension is mounting ahead of the Federal Reserve’s decision, how is the world’s most popular currency pair positioned on the charts? Resistance is stronger than support.
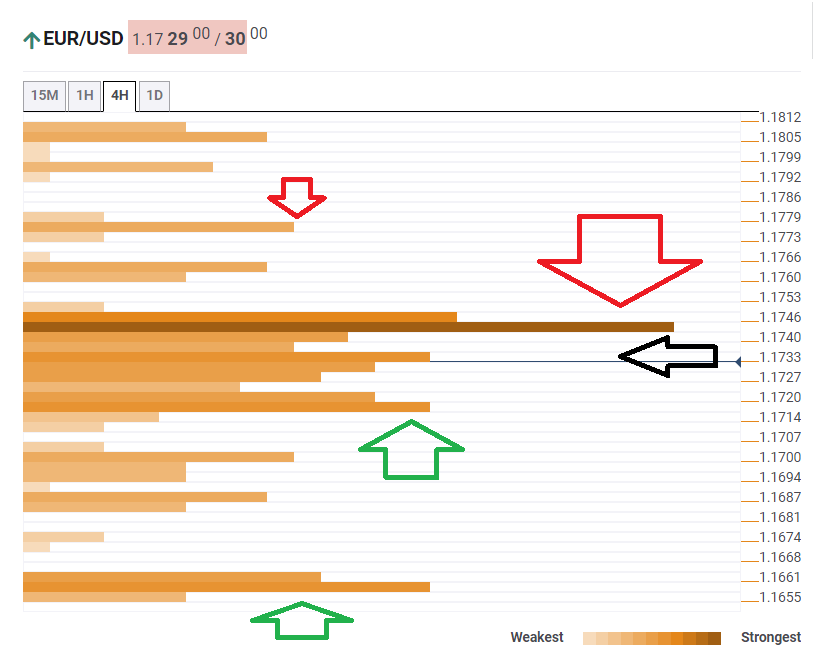
The Technical Confluences Indicator is showing that EUR/USD is struggling around 1.1733, which is the convergence of the Simple Moving Average 5-15m, thew SMA 10-15m, the Fibonacci 38.2% one-day, and more.
Euro/dollar faces fierce resistance at 1.1746, which is the confluence of the Bollinger Band one-hour Upper, the Pivot Point one-week Resistance 1, and the Fibonacci 61.8% one-day.
Further up, the 1.1773 is where the previous day’s high and the PP one-day R1 meet up.
Some support awaits at 1.1714, which is the confluence of the Fibonacci 23.6% one-day, the previous 4h-low, the BB 15min-Lower, and the SMA 5-4h.
The downside target is 1.1661, which is where the SMA 5-one-day and the PP one-day S2 converge.
Here is how it looks on the tool:
Confluence Detector
The Confluence Detector finds exciting opportunities using Technical Confluences. The TC is a tool to locate and point out those price levels where there is a congestion of indicators, moving averages, Fibonacci levels, Pivot Points, etc. Knowing where these congestion points are located is very useful for the trader, and can be used as a basis for different strategies.
Learn more about Technical Confluence

