- Gold recedes from record high of $1,988 to $1,973.
- The hourly chart shows now shows a failed triangle breakout.
An ounce of gold is changing hands near $1,973 at press time. Prices reached a fresh record high of $1,988 during the early Asian session, surpassing the previous lifetime high of $1,984 reached on Friday.
Notably, with the rise to fresh record highs, gold had confirmed an ascending channel breakout on the hourly chart. That bullish continuation pattern, however, has failed with the pullback to $1,972.
A failed breakout is widely considered as a powerful bearish signal. That, alongside a below-50 or bearish reading on the hourly chat relative strength index, suggests scope for a deeper decline to the ascending triangle support at $1,960.
On the higher side, $1,988 is the level to beat for the bulls, which, if breached, would open the doors to a potential breakout above the $2,000 mark.
Hourly chart
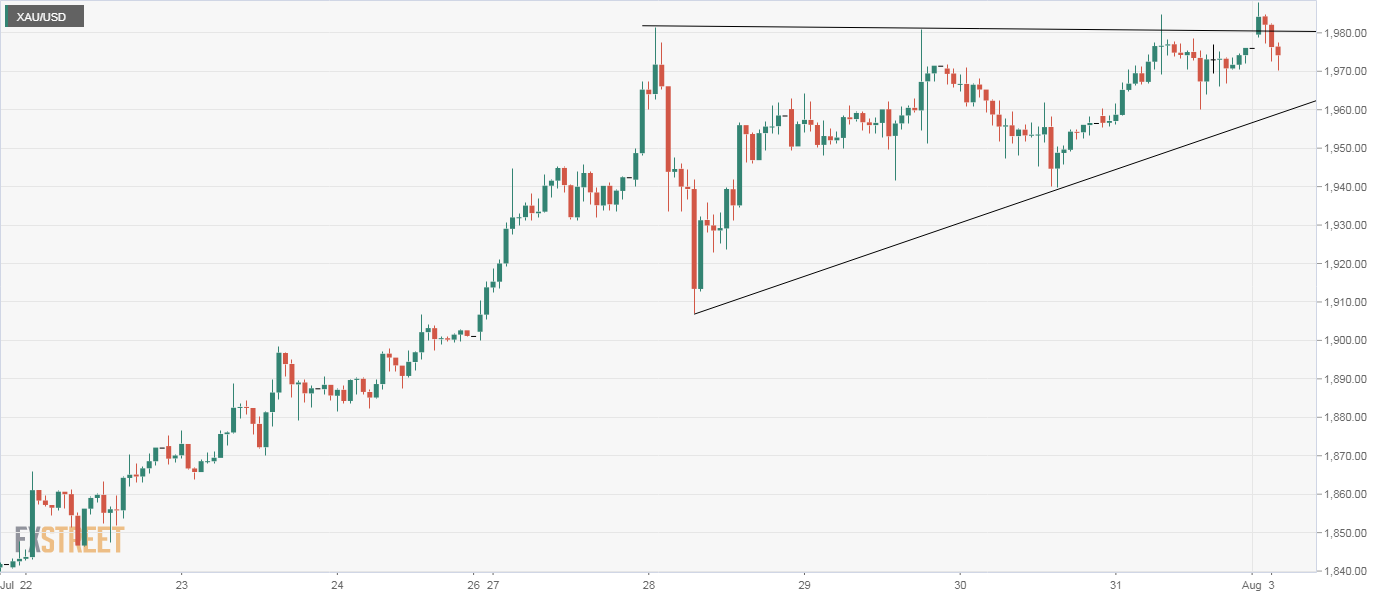
Trend: Bearish
Technical levels
