Gold has been battling its way back up after a setback at the early hours of August. Are bulls ready to push it to new all-time highs? The move substantially depends on the next swings in the dollar. After a horrible July, the greenback advanced bounced back. Nevertheless, concerns about the US economy amid raging coronavirus cases and deaths could weaken the world’s reserve currency.
XAU/USD seems well-positioned to take advantage of the next bout of buck selling to move toward higher ground, especially after topping a strong resistance line that had been capping it during long hours.
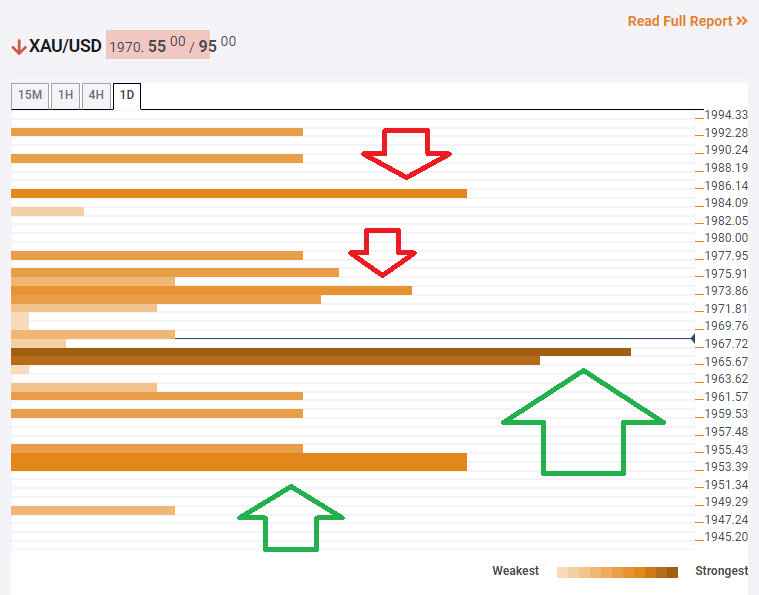
The Technical Confluences Indicator is showing that gold is trading above a dense cluster of technical levels concentrated around $1,965. This juncture includes the Fibonacci 61.8% one-day, the Bollinger Band 4h-Middle, the Fibonacci 23.6% one-week, and the BB 1h-Lower.
From that springboard, XAU/USD has room to rise, with the initial soft resistance awaiting at $1,973, which is the convergence of the Simple Moving Average 100-15m, the Fibonacci 38.2% one-day, the BB 15min-Upper, and the BB 1h-Middle.
Further above, the next target is $1,986, which is the meeting point of the previous day’s high and the BB 4h-Upper.
From there, only soft caps await the precious metal on its way to $2,000.
Below $1965, support awaits at $1,955, which is a confluence of levels including the previous daily high and the Fibonacci 38.2% one-week.
All in all, the path of least resistance is to the upside.
Key XAU/USD resistances and supports

Confluence Detector
The Confluence Detector finds exciting opportunities using Technical Confluences. The TC is a tool to locate and point out those price levels where there is a congestion of indicators, moving averages, Fibonacci levels, Pivot Points, etc. Knowing where these congestion points are located is very useful for the trader, and can be used as a basis for different strategies.
Learn more about Technical Confluence
