With the US dollar selling back on the cards, Gold’s quest for the $2000 level extends into August, as it consolidates the rebound to near $1980 region. The bulls continue to struggle at higher levels, with a convincing break to the upside awaited.
Record low US real yields and renewed US-China concerns will continue to bode well for the gold buyers while they eagerly await the developments surrounding the US fiscal stimulus package. Let’s see how the metal positioned technically, as it faces stiff resistance on its way to the key 2K mark.
Key XAU/USD resistances and supports
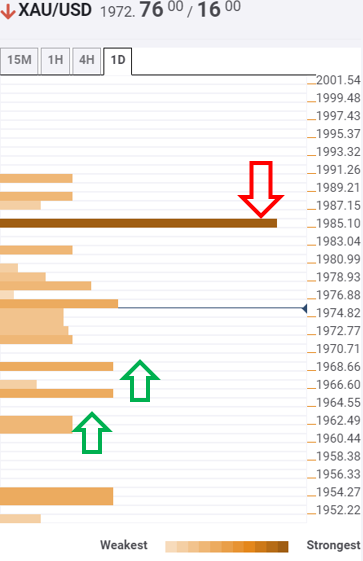
The tool shows that the bright metal is seen running into supply at $1980 in the immediate term. The level is the confluence of the Bollinger Band one-hour Upper, Fibonacci 38.2% one-day and previous high four-hour.
The next resistance is aligned at $1983, the Fibonacci 23.63% one-day. The spot needs to take out a powerful hurdle at $1985, in order to revive the bullish bias.
Alternatively, immediate support is placed at $1968, the convergence of SMA10 one-day and Bollinger Band four-hour Middle.
A failure to defend the latter, the next cushion of $1965 will offer some respite to the bulls. That is the Fibonacci 23.6% one-week support.
Further down, a cluster of support levels awaits at $1960, the intersection of the pivot point one-day S1 and the previous day low.
Here is how it looks on the tool
About the Confluence Detector
The Confluence Detector finds exciting opportunities using Technical Confluences. The TC is a tool to locate and point out those price levels where there is a congestion of indicators, moving averages, Fibonacci levels, Pivot Points, etc. Knowing where these congestion points are located is very useful for the trader, and can be used as a basis for different strategies.
Learn more about Technical Confluence

