- Gold has pulled back from the record high of $2,075.
- The 4-hour chart shows a bearish divergence of key indicators.
Gold is currently trading near $2,067 per ounce, having reached a record high of $2,075 during the early Asian trading hours.
The 4-hour chart shows a bearish divergence of both the relative strength index and the stochastic indicator. Daily chart indicators, too, are reporting overbought conditions.
As such, a further decline toward $2,060 may be seen. The overall trend, however, would remain bullish while prices are held above the ascending 10-day simple moving average, currently at $2,000.
Moreover, with central banks and governments pumping unprecedented amounts of liquidity into the global economy, scarce assets like gold are likely to continue rallying for the rest of the year.
4-hour chart
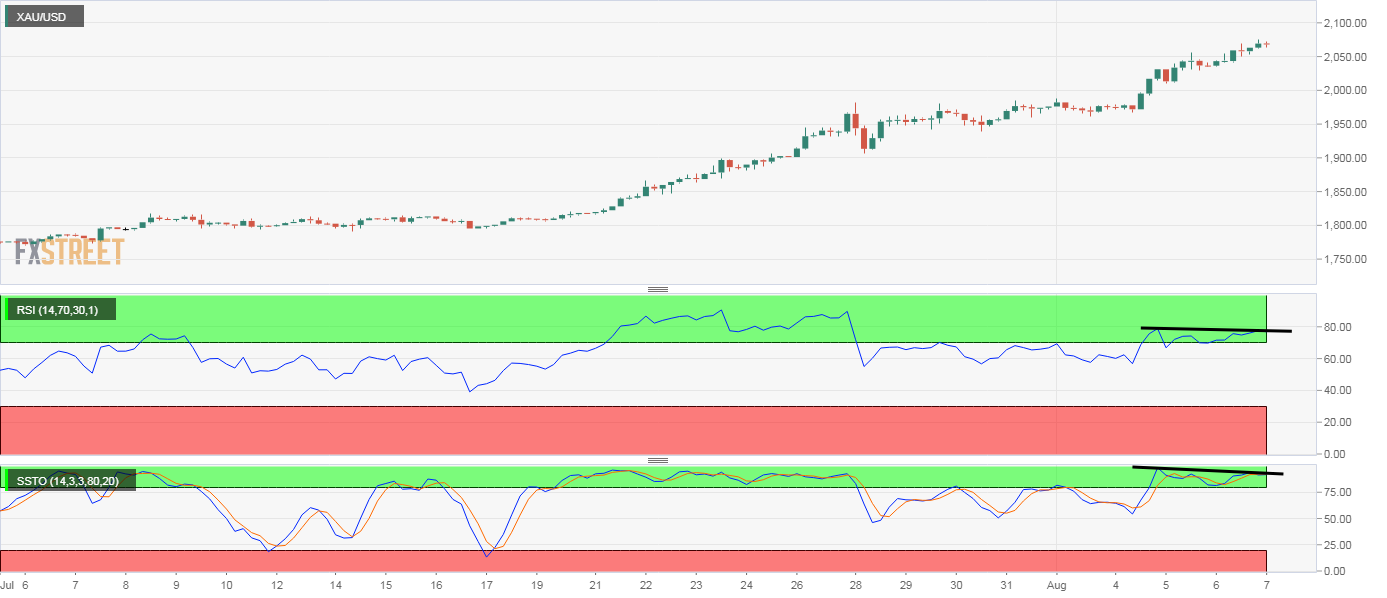
Trend: intraday bearish
Technical levels
