- AUD/JPY struggles to extend the latest pullback from 76.43.
- One-week-old support line, 200-hour EMA restricts immediate downside ahead of the immediate horizontal area.
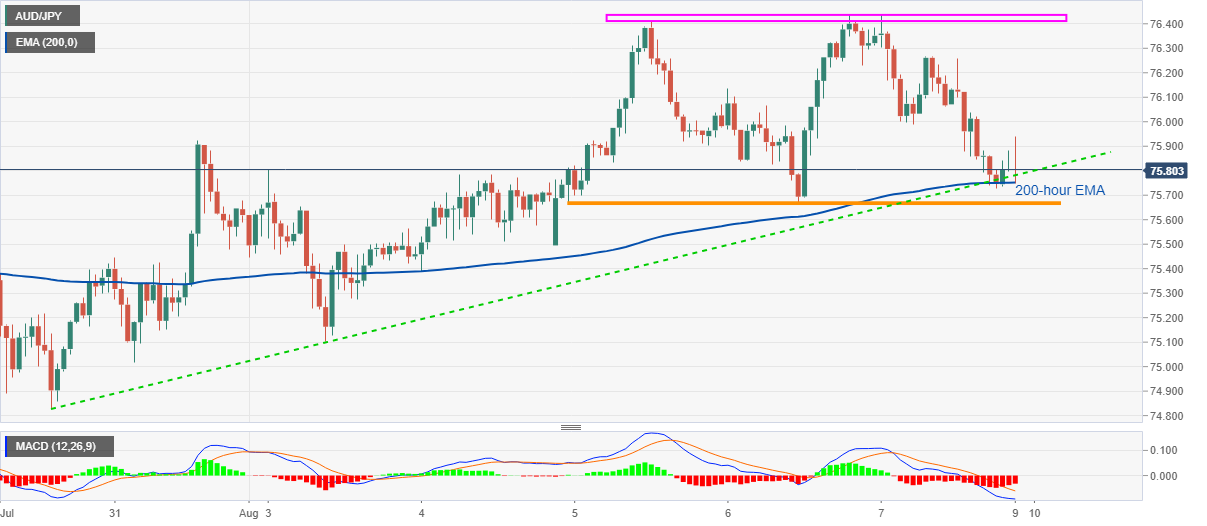
- Bearish MACD indicates further declines, bulls will have to cross 76.50 to regain traction.
AUD/JPY stays depressed around 75.80 amid the early Monday morning in Asia. The cross marked two failed attempts to cross 75.50 during the last week while forming a bearish chart pattern on the hourly chart that need confirmation. Although 200-hour EMA and an ascending support line from July 30 restrict the quote’s immediate downside, bearish MACD keeps the sellers hopeful.
As a result, a downside break of 75.65 will be a green signal for the bears targeting July 30 lows near 74.80. However, 75.50 and 75.00 round-figures may offer intermediate supports to the quote.
In a case where the AUD/JPY prices remain sluggish past-74.80, the previous month’s bottom under 74.00 will be in the spotlight.
On the upside, 76.00 and 76.30 may offer nearby resistance to the pair ahead of the “double top” area surrounding 76.40/45.
Other than the bearish formation’s upper limit, July month’s top of 76.87 and 77.00 could also challenge the bulls during the pair’s advances.
AUD/JPY hourly chart
Trend: Pullback expected
