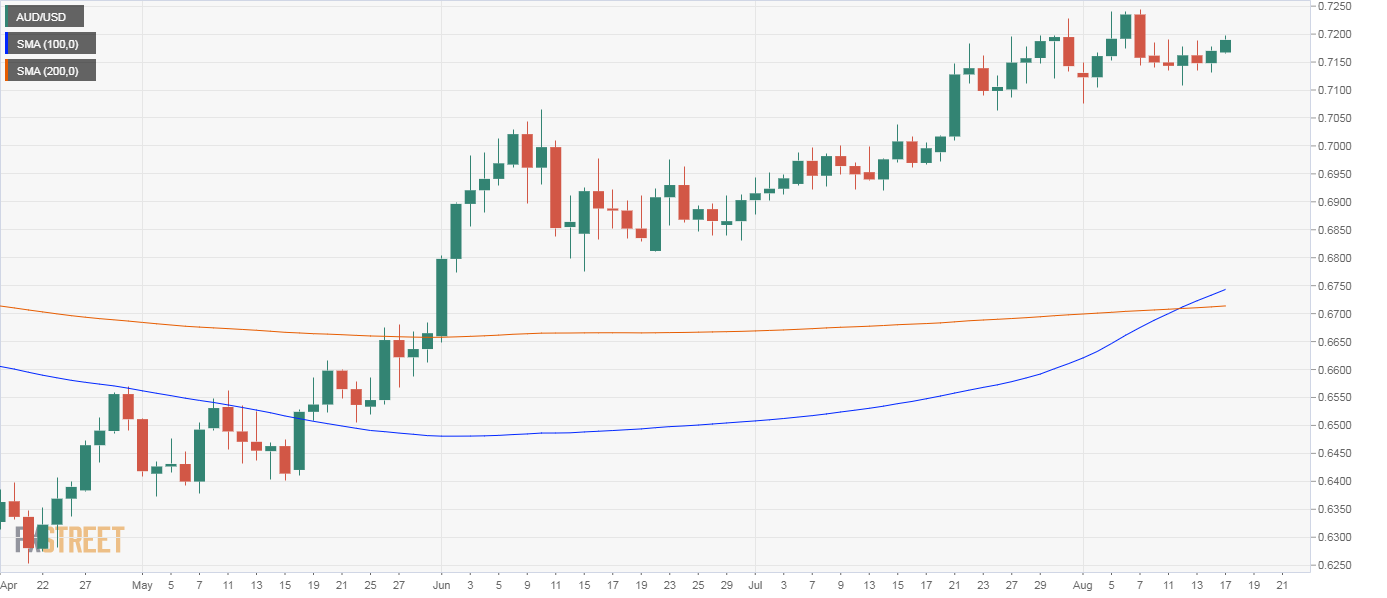
- AUD/USD’s daily chart shows a major bull cross.
- The 4-hour chart shows an inverse head-and-shoulders pattern.
AUD/USD is better bid at press time and could soon test the psychological hurdle of 0.72, as the daily chart is showing a bullish cross of the 100- and 200-day simple moving averages (SMAs).
In addition, the daily chart relative strength index is hovering in the bullish territory above 50 and the 4-hour chart shows an inverse head-and-shoulders breakout.
A move above 0.72 would expose the recent high of 0.7243 reached on Aug. 7. On the downside, the higher low of 0.7109 created on Aug. 12 is the level to defend for the bulls. A violation there would open the doors for a sell-off to the 50-day SMA, currently at 0.7006. The pair is trading at 0.7187 at press time, representing a 0.24% daily gain.
Daily chart
Trend: Bullish
Technical levels
