- EUR/JPY is sidelined near 124.78 at press time, having declined by over 1% last week.
- Last week’s candle shows uptrend exhaustion, while daily chart shows a bear cross.
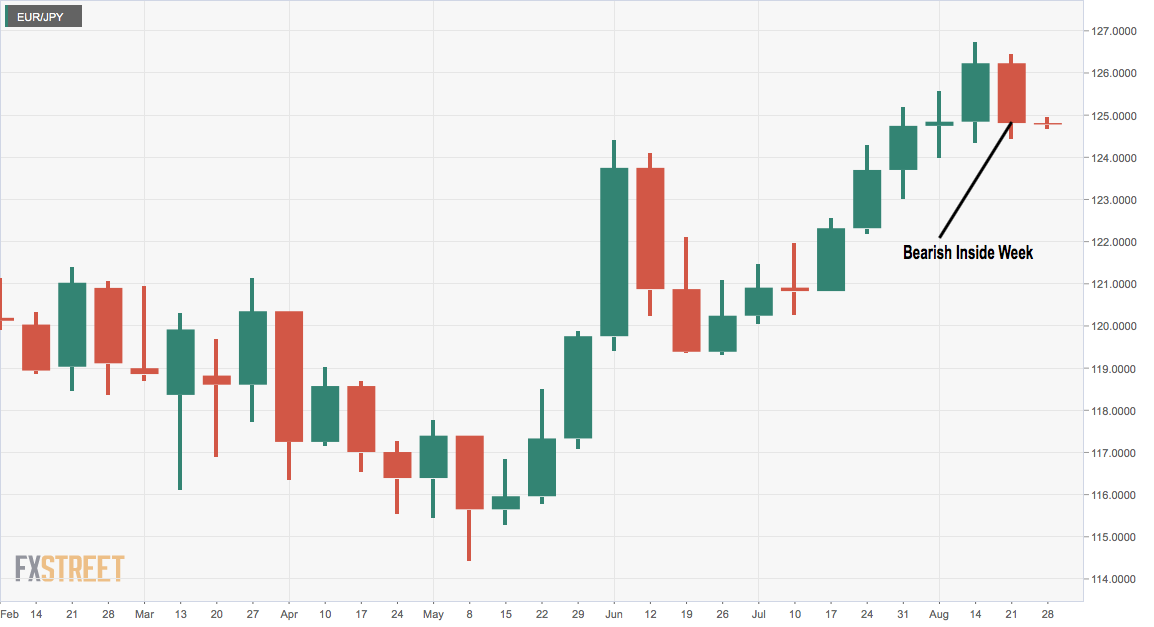
EUR/JPY fell by over 1% last week but traded well within the preceding week’s high and low, forming what is known as the bearish inside week candle on the weekly chart.
An inside week has occurred following a rally from 114.40 to 126.75 and is indicative of uptrend exhaustion.
Meanwhile, the bearish crossover of the 5- and 10-day simple moving averages (SMAs) indicate the path of least resistance is now on the downside.
As such, the pair looks set to test the immediate support at 124.29 (Aug. 11 low), which if breached, would expose the 50-day SMA, currently located at 122.90.
A move above the hourly chart lower high of 125.56 is needed to put the bulls back into the driver’s seat.
Weekly chart
Trend: Bearish
Technical levels
