- EUr/USD prints lower highs and higher lows on the hourly chart.
- Daily chart indicators favor a downside break of the hourly chart triangle pattern.
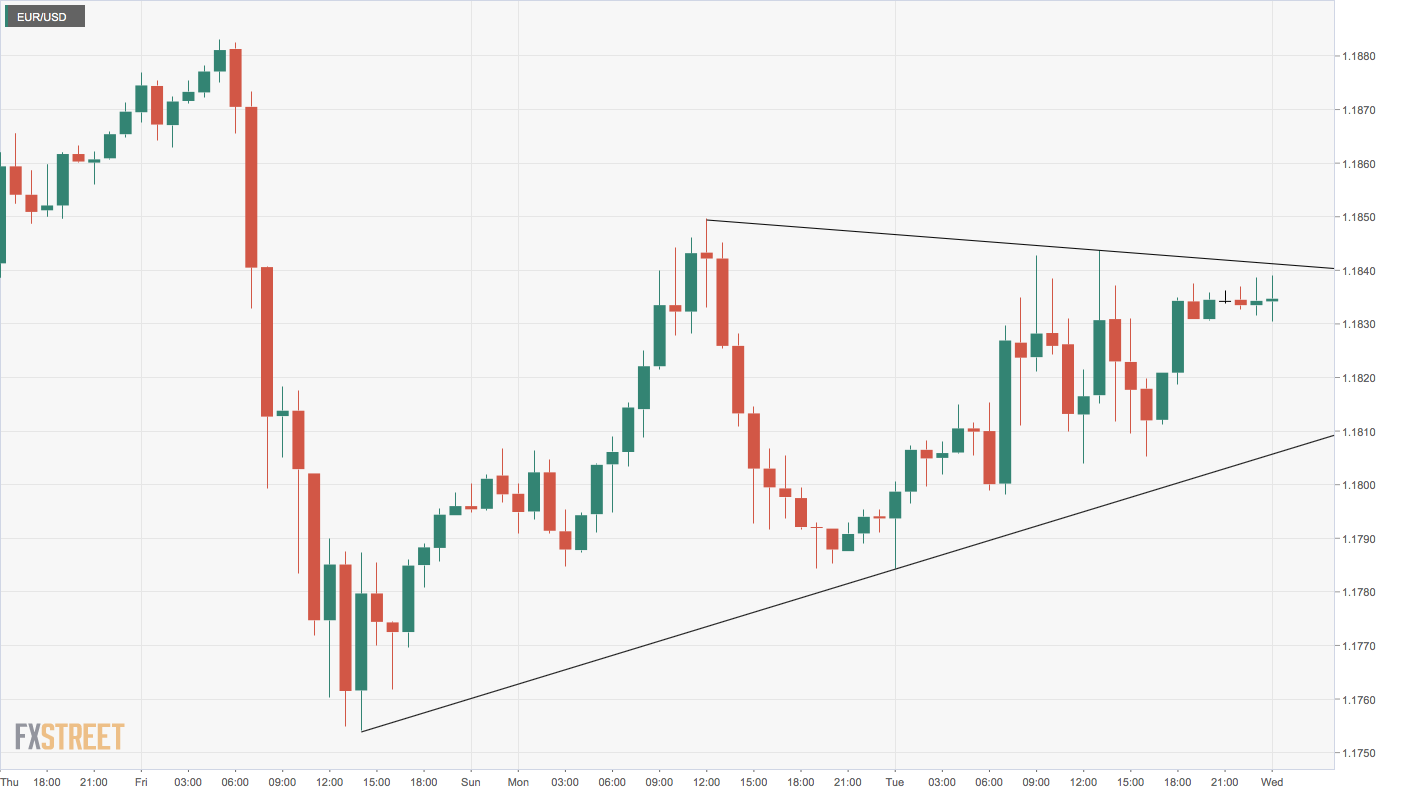
EUR/USD is consolidating in a symmetrical triangle pattern on the hourly chart.
A move above the upper end of the triangle, currently at 1.1842, would confirm the triangle breakout and open the doors to resistance at 1.1833.
Alternatively, a range breakdown, if confirmed with a move below 1.1805, would imply a continuation of the drop from the Aug. 18 high of 1.1966 and yield a deeper pullback to 1.1711 (Aug.12 low).
The 14-day relative strength index has dived out of an ascending trendline, representing an uptrend from March lows. The slow stochastic indicator is also signaling bearish conditions with a below-50 print.
As such, the hourly chart symmetrical triangle is more likely to be breached to the downside.
Hourly chart
Trend: Bearish
Technical levels
