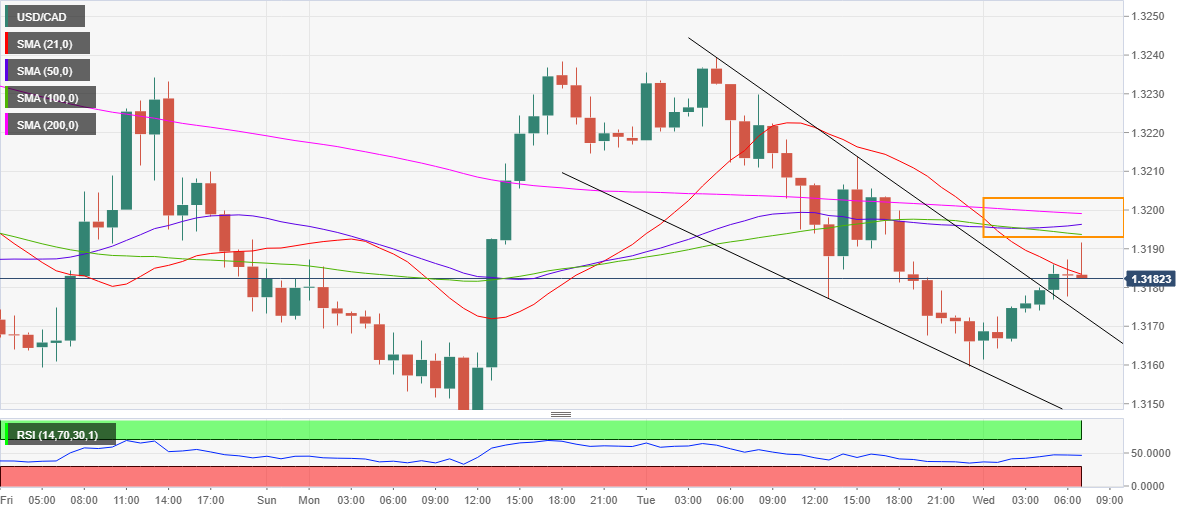
- USD/CAD charts a bullish breakout on the hourly chart.
- Bulls probing critical resistance at 1.3195.
- Hourly RSI turned bullish, eyes on US data for fresh cues.
USD/CAD has pierced above the 21-hourly Simple Moving Average (HMA) at 1.3185, having dived out of the falling wedge pattern on the hourly chart.
The spot charted a bullish breakout after it closed the hour above the 1.3181, opening doors for a test of the powerful resistance aligned at 1.3195, the confluence of the 50, 100 and 200-HMAs.
A break above the latter, the bulls would recapture the 1.32 mark, beyond which Tuesday’s high of 1.3239 could be put to test.
Alternatively, the immediate support is seen at the pattern resistance-turned-support, now at 1.3173.
USD/CAD: Hourly chart
 USD/CAD: Additional levels
 USD/CAD: Additional levels
