- The price of EUR/ZAR is headed towards a key support area that could imply a shorting opportunity on a re-run to the upside.
- Bears will be looking for a discount from the current resistance for a swing trade towards the weekly downside structure.
The price of the cross has fallen towards a 38.2% Fibonacci of the weekly rise as bears stepped up in full force below the head and shoulders neckline on the daily chart.
Meanwhile, there is a shift in the positioning data that has favoured the kiwi, but bears will be hoping for a retracement back to test the daily resistance from daily support following a test of the 38.2% Fibonacci.
At that juncture, there are higher probabilities of a re-run to the downside and a possible break of support towards the weekly W-formation target.
Monthly resistance
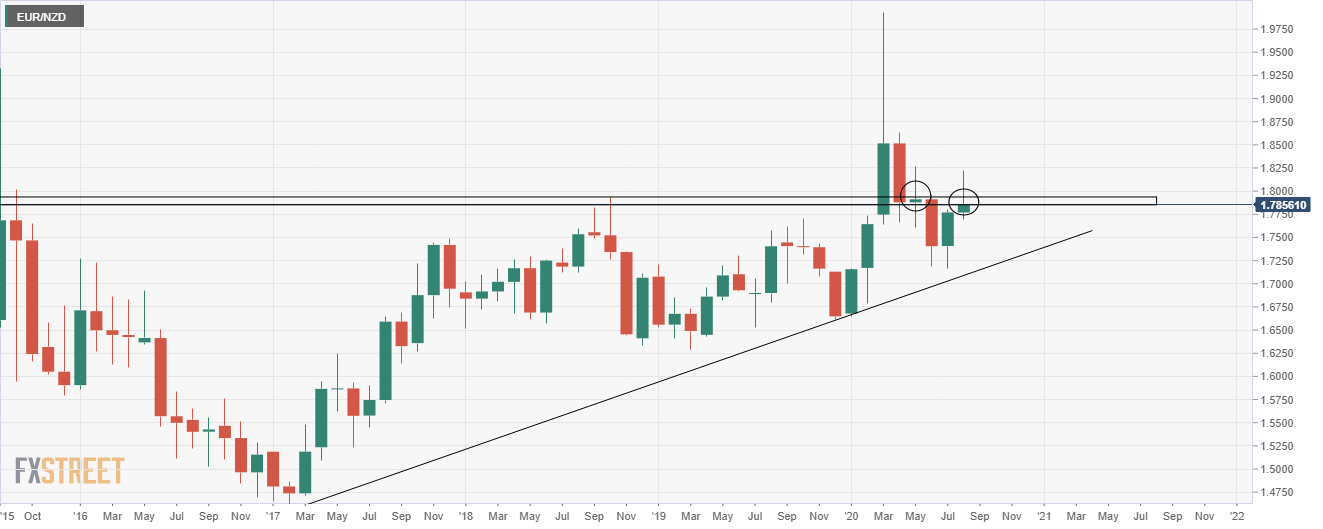
The above chart illustrates the latest monthly resistance for which the eclipsed Doji candle acts as a resistance structure candle.
Weekly W-formation target
-637340870833167666.png)
Daily head and shoulders define new resistance structure
-637340871159905302.png)
The daily head and shoulders is now offering a resistance level for the bulls to target which could provide the bears with another crack at the whip for a longer-term seeing trading opportunity.
