- Silver takes a U-turn from form the weekly high of $27.52.
- Bearish candlestick formation highlights 50-bar SMA, 61.8% of Fibonacci retracement for sellers.
- Friday’s top holds the key to pair’s further upside.
Silver refrains from extending the previous day’s bullish momentum while declining to $27.32, down 0.66% on a day, amid the early Thursday. In doing so, the white metal respects the Doji candlestick formation on the four-hour (4H) chart.
Considering this, sellers are currently targeting a 50-bar SMA level of $23.03, a break of which could direct them to 61.8% Fibonacci retracement of August 14-18 upside, at 26.78.
Should the bears conquer the key Fibonacci support, $26.00 and $25.75 holds the key to the quote’s slump towards the monthly bottom surrounding $23.40.
Meanwhile, a clear break of $27.55, comprising Friday’s peak, can trigger the bullion’s fresh rise towards $28.00 and then to $28.47.
While the bulls are less likely to find acceptance above $28.50, a surprise run-up might not hesitate to challenge the multi-month high near $29.85.
Silver four-hour chart
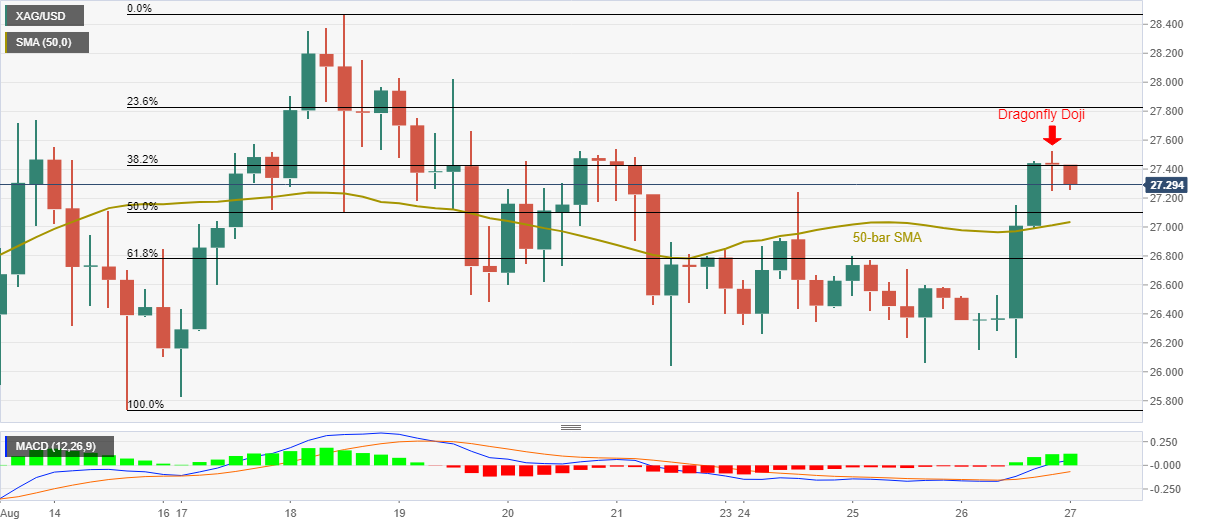
Trend: Further weakness expected
