- GBP/USD pullback from the lowest since July 24 flashed the previous day.
- Ascending trend line from March 20 adds to the upside barriers.
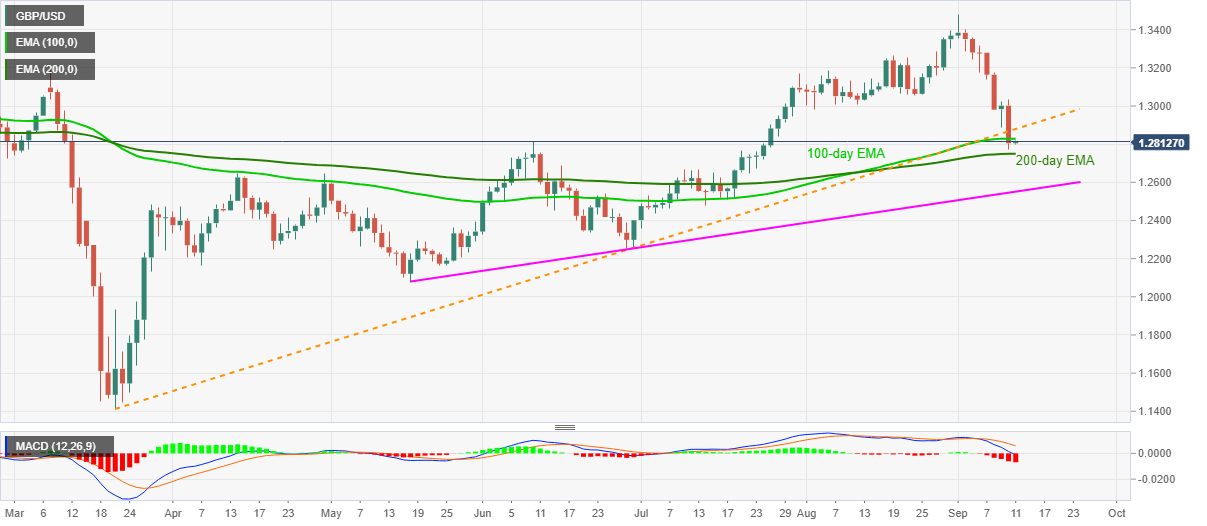
- 200-day EMA, a four-month-old support line can challenge the bears.
GBP/USD retraces from the multi-day low to 1.2812 during the early Friday morning in Asia. Even so, 100-day EMA and a six-month-old resistance line, previous support, question the pair’s consolidation amid bearish MACD.
As a result, the quote’s another attempt to break the 200-day EMA level of 1.2750 can’t be ruled out. In doing so, the early-July tops surrounding 1.2670/65 will be on the sellers’ radars.
In a case where GBP/USD prices remain weak below 1.2665, an upward slopping trend line from May 18, at 1.2550 now, will be the key.
Alternatively, a daily close beyond the 100-day EMA level of 1.2830 will have to cross the support-turned-into-resistance, around 1.2875, to regain the power in attacking August month’s low near 1.2985/80.
It should, however, be noted that the 1.3000 psychological magnet and August 24 bottom close to 1.3055 will challenge the bulls after 1.2985.
GBP/USD daily chart
Trend: Bearish
