Gold has been experiencing the calm before the storm – typical for days when investors are nervously tapping on their desks awaiting the Federal Reserve’s decision. The world’s most powerful central bank may provide more details on its dovish policy shift and boost the precious metal.
On the other hand, the absence of imminent action to stimulate a still-struggling economy could trigger a painful downfall.
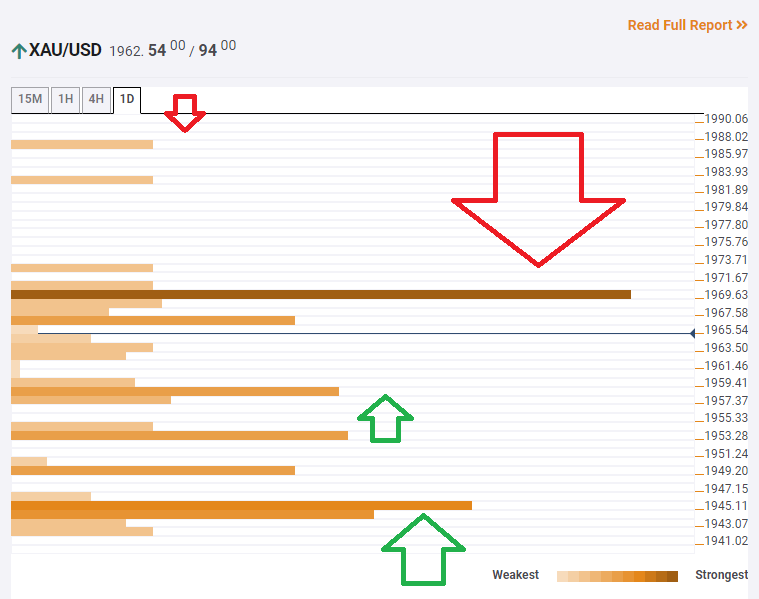
XAU/USD’s position on the charts seems bearish.
The Technical Confluences Indicator is showing that gold faces fierce resistance at around $1,970, which is the convergence of several lines including the Pivot Point one-week Resistance 1, the Bolligner Band 4h-Upper, the BB one-day Upper, and more.
If XAU/USD overcomes this hurdle, the upside target is $1,986, which is where the Fibonacci 161.8% one-day hits the price.
There are several support clusters on the way down, with two notable ones. First, at $1,958, the confluence of the Fibonacci 38.5% one-day, the BB 1h-Middle, and the Simple Moving Average 200-15m awaits gold.
A considerable cushion awaits it at $1,945, which is where the Fibonacci 38.2% one-month, and the Pivot Point one-day Support 1 await gold.
Overall, the path of least resistance is down.
Key XAU/USD resistances and supports
Confluence Detector
The Confluence Detector finds exciting opportunities using Technical Confluences. The TC is a tool to locate and point out those price levels where there is a congestion of indicators, moving averages, Fibonacci levels, Pivot Points, etc. Knowing where these congestion points are located is very useful for the trader, and can be used as a basis for different strategies.
Learn more about Technical Confluence
