- USD/CNH rises to seven-day high while extending Friday’s pullback from 6.6786.
- Bullish MACD favor buyers to cross immediate resistances.
- Sellers need a clear break of 6.7130 for re-entry.
- China’s Trade Balance with the US rose to 2.3 trillion yuan during the January-September period.
USD/CNH rises to 6.7530, up 0.20% on a day, during early Tuesday. The quote recently surged to the highest since October 02 while probing a downward sloping trend line from September 25.
It should be noted that China’s customs recently said that trade with the United States rose 2.3% from January to September.
Even if 100-bar SMA joins the forces against the pair’s latest upside, the bullish MACD signal suggests the buyers will overcome the 6.7650 and 6.7715 immediate hurdles to the north.
In doing so, the 61.8% Fibonacci retracement of September 24 to October 09 downside, near 6.7825, will lure the USD/CNH bulls.
Alternatively, a downside break of 382% Fibonacci retracement level close to 6.7420 will aim for one-week-long horizontal support around 6.7130.
If at all the bears manage to conquer the 6.7130 support, the recently flashed lows, also the lowest since April 2019, around 6.6785, will be in focus.
USD/CNH four-hour chart
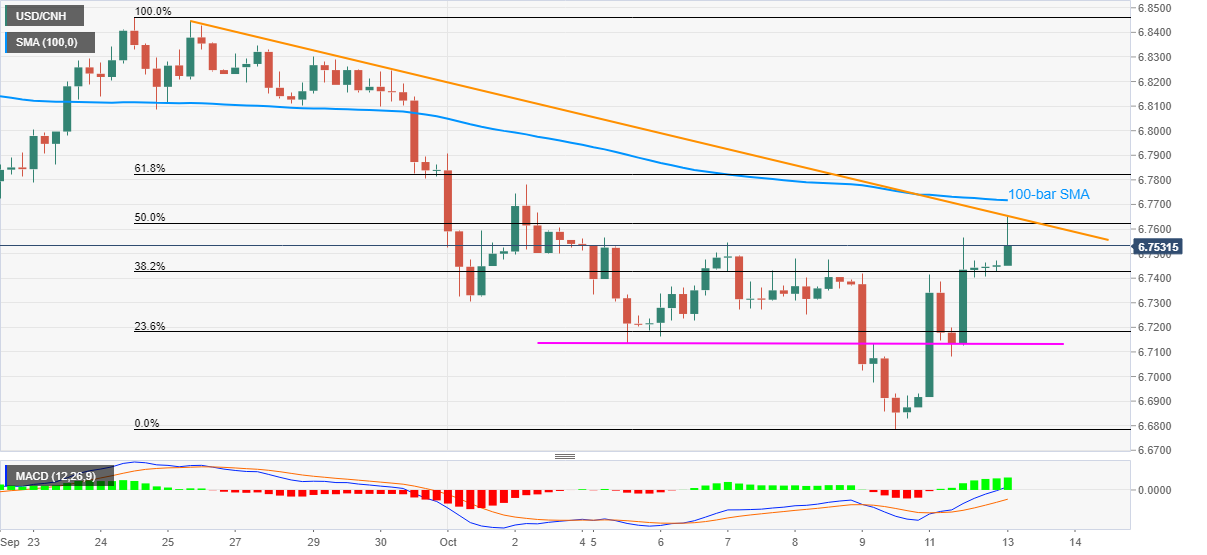
Trend: Bullish
