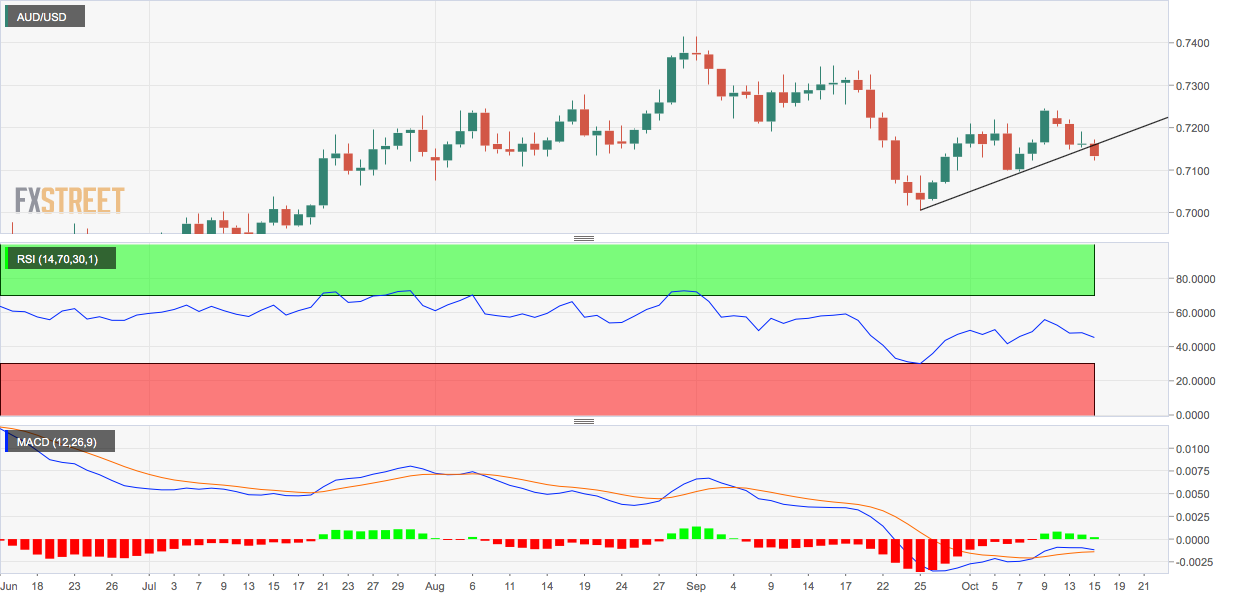
- AUD/USD dives out of an ascending trendline on dovish RBA expectations.
- The breakdown is backed by bearish readings on key technical indicators.
AUD/USD looks south, having breached trendline connecting Sept 25 and Oct 7 lows early Thursday.
The downside break of the ascending trendline indicates a resumption of the sell-off from the Sept 1 high of 0.7413.
Backing the breakdown is the below-50 or bearish reading on the 14-day relative strength index. Additionally, the MACD histogram is about to cross into the bearish territory below zero.
As such, the pair could challenge support at 0.7096 (Oct 7 low). A violation there would expose the Sept 25 low of 0.7006.
Alternatively, a close above the Oct 9 high of 0.7243 is needed to invalidate the bearish lower highs setup on the daily chart and put the bulls back into the driver’s seat.
However, the Reserve Bank of Australia is expected to cut rates to 0.10% in November from the current record low of 0.25%. Hence, the bulls are likely to remain on the sidelines, allowing for a deeper decline in the currency pair. The pair is currently trading at 0.7130.
Daily chart
Trend: Bearish
Technical levels
