- USD/JPY eases from intraday high of 105.29, bounced off an ascending trend line from September 22 the previous day.
- Bearish MACD favor sellers but multiple supports below 105.00 signal bumpy road ahead.
- One-week-long resistance line and 200-bar SMA restrict immediate upside.
USD/JPY drops to 105.20 during the early Thursday’s pullback from intraday high near 105.30. Even so, the pair prints 0.05% gains on a day while also keeping its U-turn from the short-term support line, portrayed the previous day.
With the MACD flashing bearish signals, sellers are watching over the three-week-old support line, near 105.00, for fresh entries.
The monthly low near 104.95 and a horizontal line including multiple levels since September 16 at 104.90 are extra filters to the USD/JPY south-run.
If at all the bears manage to conquer 104.90, the 104.40 and the previous month’s low near 104.00 will return to the charts.
On the upside, a descending trend line from October 09, at 105.42, will precede the 200-bar SMA level of 105.60 to restrict the pair’s short-term advances.
Also likely to challenge the USD/JPY bulls is the 61.8% Fibonacci retracement level of the August-September downside as well as the monthly high, respectively around 105.80 and 106.10.
USD/JPY four-hour chart
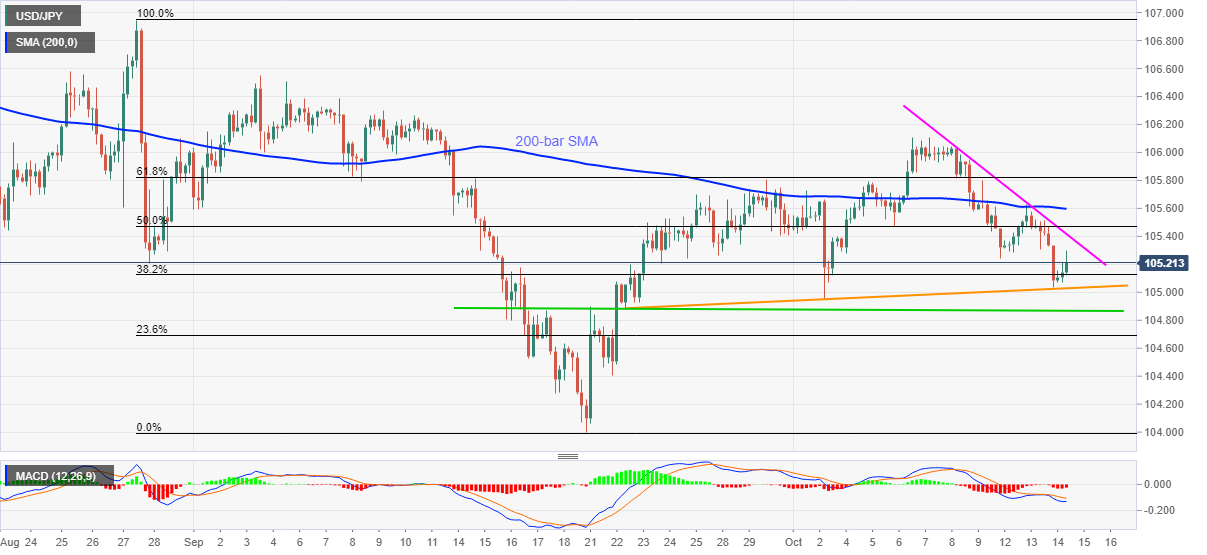
Trend: Bearish
