- AUD/USD has breached key support for the first time in five months.
- The daily chart indicators indicate scope for continued sell-off.
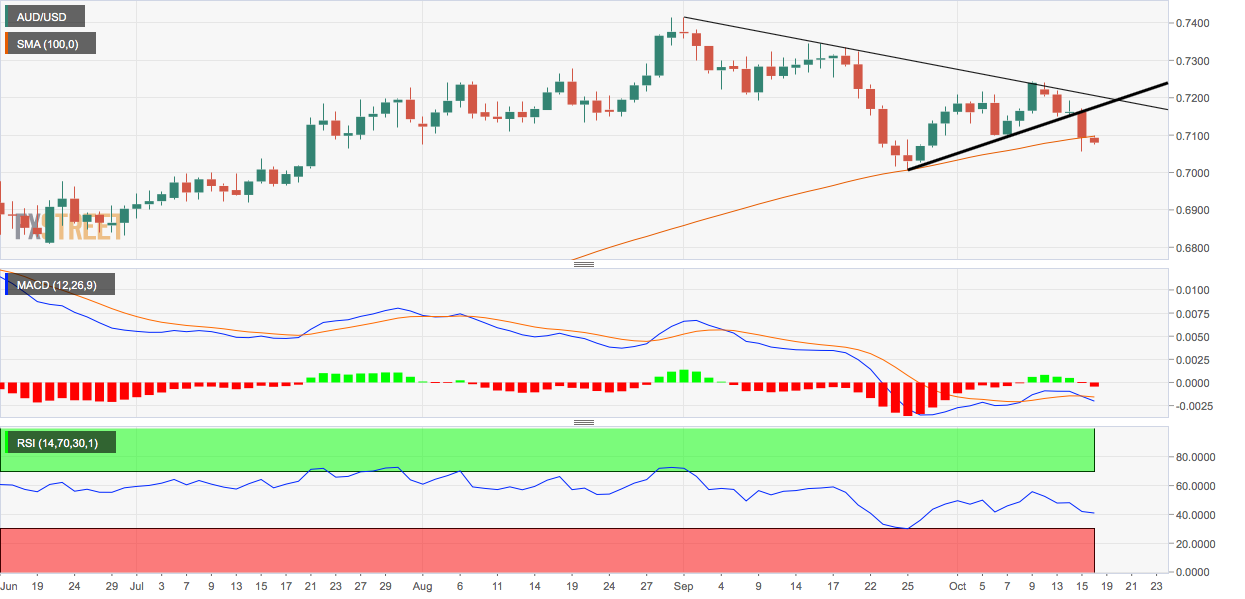
AUD/USD is trading below its 100-day simple moving average (SMA) for the first time since May 18.
At press time, the pair is trading at 0.7080, representing a 0.16% decline on the day. Meanwhile, the 100-day SMA is located at 0.7096.
A close below that SMA support would validate the bearish view put forward the daily chart indicators and could yield deeper declines.
The MACD histogram has crossed into a bearish territory below zero. The below-50 reading on the 14-day relative strength index indicates the path of least resistance is to the downside.
Further, the trendline connecting Sept. 1 and Sept. 16 highs is intact. Meanwhile, the downside break of the ascending trendline rising from Sept. 25 and Oct. 7 lows is still valid.
Support is located at 0.7006 (Sept. 25 low), while resistance is seen at0.7243 (Oct. 9 high).
Daily chart
Trend: Bearish
Technical levels
