- Silver eases from intraday high of $24.33 after posting a bearish candlestick on D1 the previous day.
- Sustained trading below 1.5-month-old falling trend line also favors the sellers.
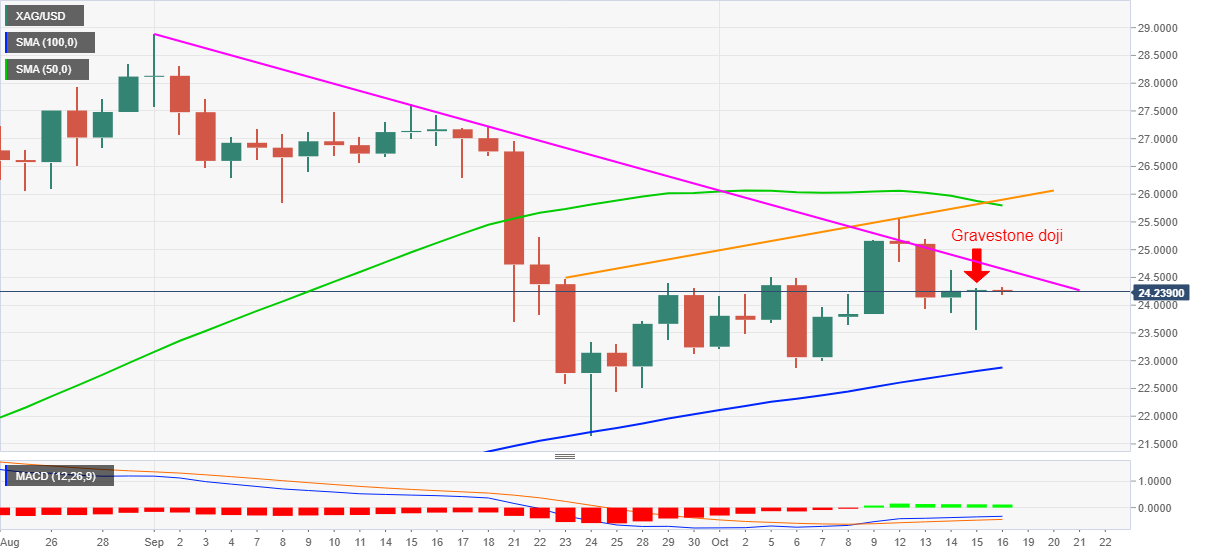
- 50-day SMA and a three-week-old rising line add to the upside barrier.
Silver prices fizzle recovery moves, portrayed during Thursday’s US session, while easing from $24.33 to $24.22 during Friday’s Asian trading.
In doing so, the white metal respects the gravestone Doji, bearish candlestick, formation on the daily (D1) chart for the previous day while also ignoring bullish MACD. Another reason for the bears to be hopeful is a downward sloping trend line from September 01.
As a result, silver sellers are likely to retake controls with the $24.00 round-figure acting as immediate support ahead of the confluence of 100-day SMA and the monthly low near $22.85/90.
However, the $23.60 and the $23.00 may act as buffers during the fall that can attack the September month’s low of $21.65 on the downside break of $22.85 support.
On the flip side, a six-week-old resistance line near $24.65 offers immediate resistance to the bullion buyers before directing them to the monthly high of $25.56.
However, no further advances can be expected beyond $25.56 unless the quote manages to cross the 50-day SMA level of $25.80, followed by a successful clearance of an ascending trend line from September 23, at $25.90.
Silver daily chart
Trend: Pullback expected
