Gold has been clawing its way up above $1,900 as hopes for US stimulus have re-emerged. House Speaker Nancy Pelosi and Treasury Secretary Steven Mnuchin will hold another call. If they manage to agree on a multi-trillion relief package, it could boost the precious metal, while yet another failure could push it down.
How is XAU/USD positioned on the charts?
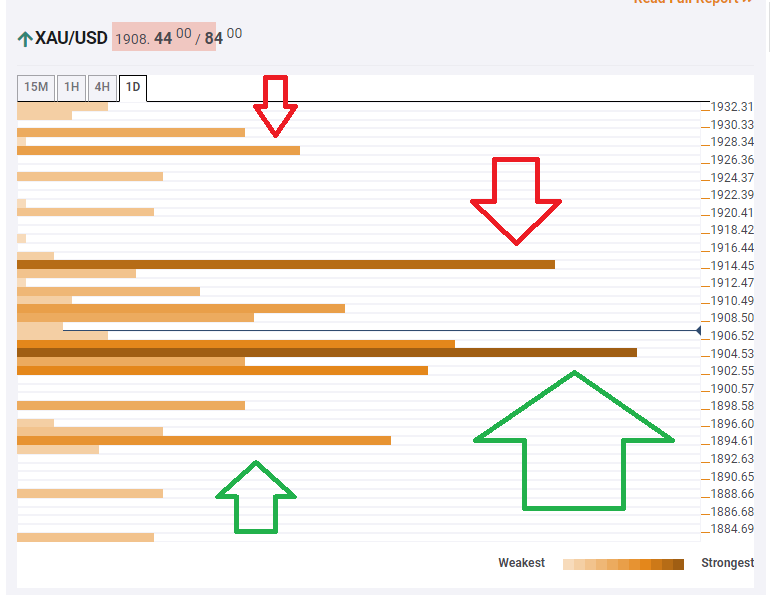
The Technical Confluences Indicator is showing that gold has robust support at around $1,904, which is a dense cluster of levels including the Fibonacci 38.2% one-month, the Fibonacci 38.2% one-day, the Simple Moving Average 5-4h, the SMA 200-1h, the SMA 10-4h, and the Bollinger Band 1h-Middle.
Looking up, a significant cap awaits at $1,915 – yet it is weaker than the support line mentioned above, opening the door to more upside. At $1,915, a juncture of lines including the SMA 200-4h, the Fibonacci 61.8% one-week and the previous daily high await XAU/USD.
Further above, the upside target is $1,927, which is the confluence of the Pivot Point one-day Resistance 3 and the 50-day SMA.
Low support is at $1,894, which is the meeting point of the PP one-day S1 and the Fibonacci 23.6% one-week.
Key XAU/USD resistances and supports
Confluence Detector
The Confluence Detector finds exciting opportunities using Technical Confluences. The TC is a tool to locate and point out those price levels where there is a congestion of indicators, moving averages, Fibonacci levels, Pivot Points, etc. Knowing where these congestion points are located is very useful for the trader, and can be used as a basis for different strategies.
Learn more about Technical Confluence
