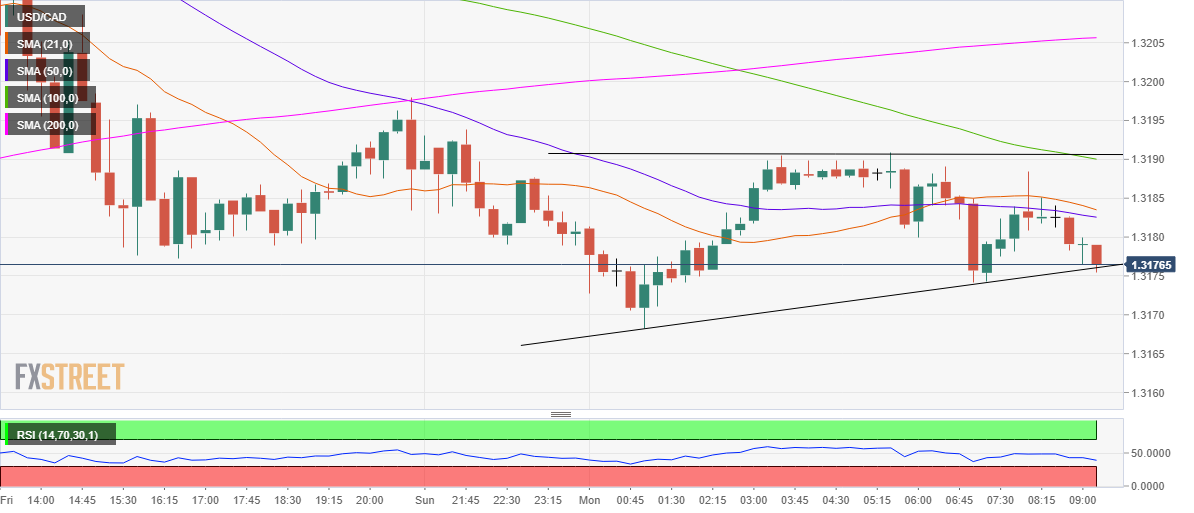
- USD/CAD eyes ascending triangle breakdown on 15-minutes chart.
- The spot trades below all the key simple moving averages (SMA).
- Relative Strength Index (RSI) points lower while below 50.00.
USD/CAD has bounced-off a dip to the weekly lows of 1.3169 but the outlook doesn’t appear constructive in the near-term.
Despite the quick retracement, the spot still remains below the 1.3200 level, as it on the verge of an ascending triangle breakdown, as spotted on the 15-minutes chart.
A sustained break below the rising trendline support of 1.3176 will validate the pattern, paving way for a test of the 1.3150 in the upcoming hour.
Backing the case for further declines, the RSI on the given timeframe trades in the bearish region while pointing south at 37.91. Also, the spot trades below all major SMAs, suggesting that the downside appears more compelling amid a lack of healthy support levels.
On the flip side, the confluence of the 21-SMA on the 15-minutes chart and 50-SMA at 1.3183 will limit the immediate upside. A break above which the 100-DMA barrier at 1.3190 will get tested.
Further north, the buyers need to take out the 200-SMA at 1.3206 in order to negate the near-term bearish momentum.
USD/CAD: 15-minutes chart
USD/CAD: Additional levels
