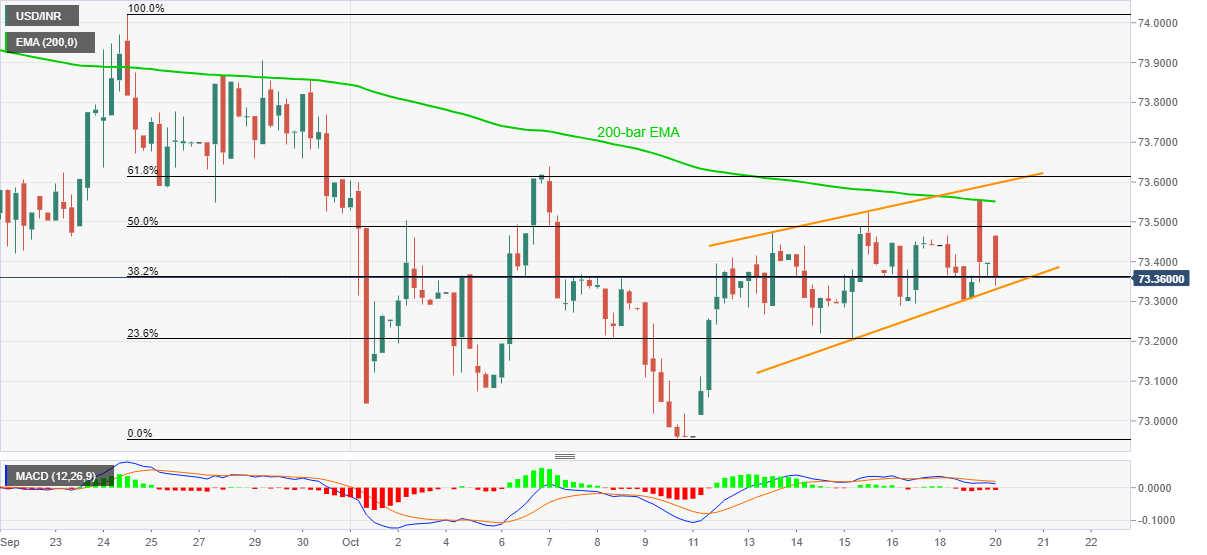
- USD/INR keeps pullback moves from 200-bar EMA inside a bearish chart pattern.
- MACD histogram also favors the sellers targeting to refresh the monthly low.
- 61.8% Fibonacci retracement adds to the upside barriers.
USD/INR remains depressed around 73.36, down 0.03% intraday, ahead of the Indian market open on Tuesday. The pair took a U-turn from 200-bar EMA the previous day while snapping a two-day uptrend.
With the bearish MACD joining the quote’s pullback from the key EMA, sellers are likely to keep the reins.
However, a confirmation of the short-term rising wedge bearish formation on the four-hour chart (H4), with a downside break of 73.33 support line, becomes necessary for the sellers to tighten their grips.
Following that, the 73.00 threshold can offer an intermediate halt ahead of directing the USD/INR bears to challenge the monthly low of 72.95.
Meanwhile, an upside clearance of 200-bar EMA, currently around 73.55, will have to cross the bearish chart pattern’s resistance line, at 73.60, to defy the downside signals.
It should also be noted that 61.8% Fibonacci retracement of the pair’s September 24 to October 09 downside, at 73.62, followed by the October 07 high of 73.64, will raise bars for the USD/INDR bull’s entry past-73.60.
USD/INR daily chart
Trend: Bearish
