- GBP/USD keeps recovery moves from 1.2930, prints four-day winning streak.
- Sustained trading above the short-term key EMA favors bulls to again challenge the seven-week-old falling resistance line.
- An ascending trend line from September 23 adds to the downside barrier.
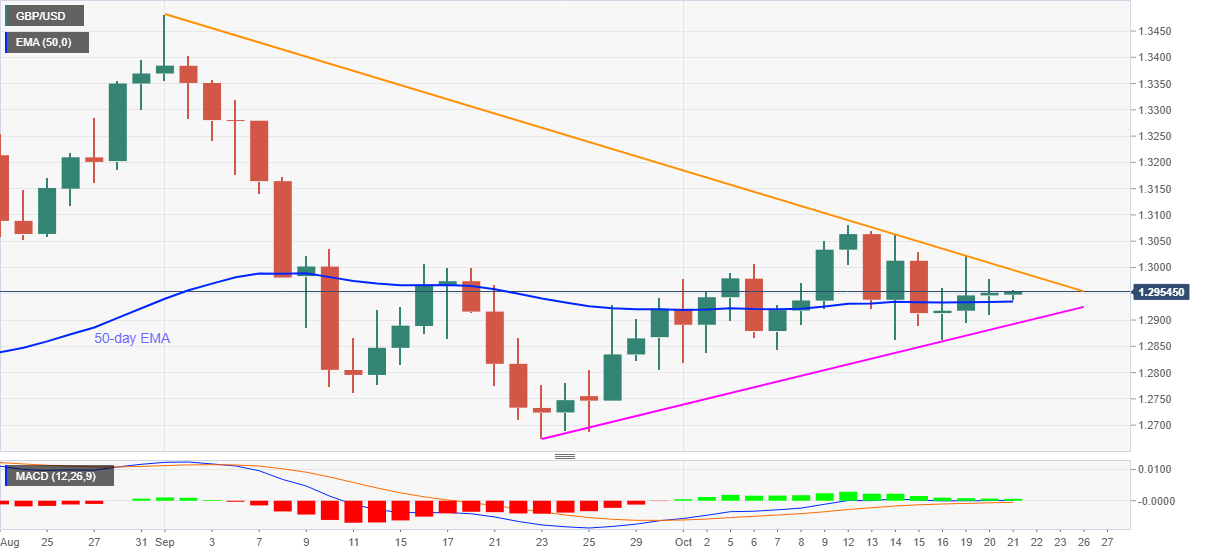
GBP/USD picks up the bids near 1.2950/55 during Wednesday’s Asia session. In doing so, the quote remains positive for the fourth day in a row while keeping Monday’s upside break of the 50-day EMA.
With the bullish MACD favoring the EMA breakout, GBP/USD buyers can aim for the falling resistance line from September 01, at 1.2995 now.
However, the pair’s upside past-1.2995 will challenge the monthly peak surrounding 1.3085 only if there prevails a sustained break of the 1.3000 threshold.
Meanwhile, a one-month-long support line near 1.2890 offers an extra back-up to the GBP/USD bulls even if they fail to bounce off the 50-day EMA level of 1.2935.
In a case where the quote drops below 1.2890, the monthly low of 1.2820 can act as a buffer before dragging prices to the previous month’s low of 1.2675.
GBP/USD daily chart
Trend: Further recovery expected
