Gold is struggling to extend the bounce above $1900 amid a broad-based US dollar recovery. Signs of progress on the US fiscal stimulus front are seemingly boding well for the US dollar, as markets re-price the likelihood of Fed rate hikes. Investors believe that the Fed could bring forward a rate hike if the US lawmakers strike a stimulus deal in the near term.
Meanwhile, the final Presidential election debate saw both sides playing the blame-game on the fiscal aid bill. Focus shifts to the US Preliminary Markit PMIs and stimulus update for a fresh take on gold prices.
How is gold positioned technically?
Gold: Key resistances and supports
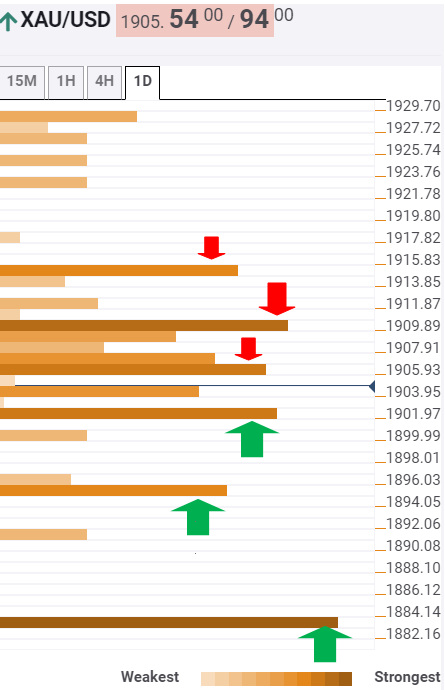
The Technical Confluences Indicator shows that the bright metal is battling a cluster of healthy resistance levels around $1906/1907, where the previous low one-hour coincides with the Fibonacci 38.2% one-day and SMA100 four-hour.
The next powerful resistance is seen at $1911, which is the SMA10 one-day level. Acceptance above the latter is needed to confront the $1915 cap, the convergence of the Fibonacci 61.8% one-week and one-day.
Thus, it can be seen that it would be an uphill task for the bulls to regain the upside momentum.
Alternatively, should the critical cushion at $1902 (Fibonacci 38.2% one-week and Fib 23.6% one-day confluence) give way, the rates could drop directly to the next downside target at $1895 (previous day low).
Further south, the fierce support at $1883 could be tested. That level is the meeting point of the Fibonacci 23.6% one-month and the previous week low.
Here is how it looks on the tool
About Confluence Detector
The Confluence Detector finds exciting opportunities using Technical Confluences. The TC is a tool to locate and point out those price levels where there is a congestion of indicators, moving averages, Fibonacci levels, Pivot Points, etc. Knowing where these congestion points are located is very useful for the trader, and can be used as a basis for different strategies.
Learn more about Technical Confluence

