- Gold picks up the bids, keeps Friday’s recovery moves.
- 200-HMA, eight-day-old resistance line offers tough resistance following the confirmation of a bullish chart pattern.
- September lows can entertain short-term bears before highlighting early-July top.
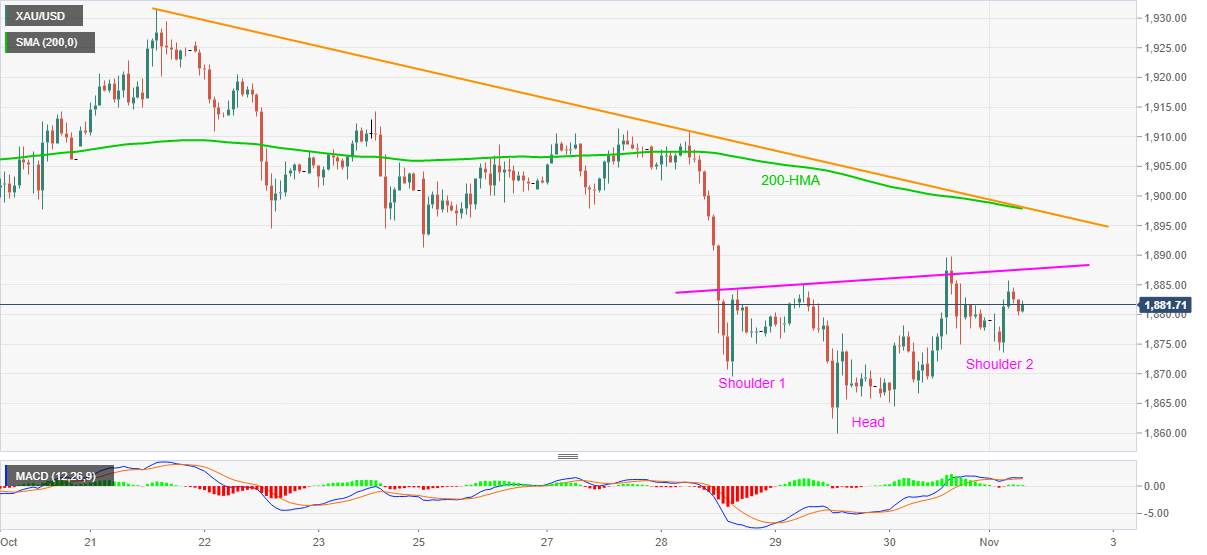
Gold prices print mild gains of 0.16% on a day while taking rounds to $1,882 during the pre-European session trading. In doing so, the yellow metal portrays an inverse head and shoulders bullish chart pattern on the hourly (1H) formation.
With the MACD flashing bullish signals, even if milder, odds of the quote’s upside break to the pattern’s neckline, at $1,887.60 now, become brighter.
However, a confluence of 200-HMA and a falling trend line from October 21 can challenge gold buyers around $1,892 afterward. During the metal’s sustained run-up past-$1,892, the $1,900 threshold holds the key to further upside.
Alternatively, $1,873 and the previous month’s low near $1,860 can act as immediate supports ahead of highlighting the September month’s low near $1,848.
While buyers are likely to return around the September bottom, any more weakness below the same might not refrain from challenging the early-July tops near $1,818.
Gold hourly chart
Trend: Further recovery expected
